

CIO Summary
Fed Wildcard unfolds as the war on inflation begins. The global fight against oil-driven inflation has begun, as the ECB is widely expected to raise rates this week with macro data pushing the Fed toward a more hawkish stance. The probability of a Fed rate hike by year-end has surged to 72% from 45% a week ago (CME FedWatch).
Multiple contractions already underway. History shows that the most direct impact of higher inflation and rates on equities is valuation compression: a sharp sell-off without immediate deterioration in underlying fundamentals. The recent corrections in AI stocks under macro pressures suggest this contraction is already happening, though it has so far been transitory.
Flash crashes to resurface; September a key turning point. We expect volatility spikes to continue, as the market oscillates between rate‑driven pullbacks and AI‑driven rebounds. Sustained macro repricing risk will likely kick in around September before the expected Fed rate hike in December.
Our All ETF Model Portfolio gained 1.6% in May and returned 5.7% YTD. This was mainly driven by Nasdaq 100 (QQQ) +10.6% and EM ex-China (EMXC) +12.0% and. We continue to underweight equities, equal-weight bonds and overweight gold.
Our US Stock Model Portfolio advanced 4.0% in May and 10.8% YTD. Top 3 performers: Micron (MU) +87.8%, Snowflake (SNOW) +87.3%, AppLovin (APP) +37.4%.
Our China Stock Model Portfolio fell 2.5% in May and dropped 2.5% YTD. Top 3 performers: Montage Technology (688008.SH) +47.4%, Weichai Power (000338.SZ) +14.4% and TSMC (TSM) +5.7%.
Our next CIO Series webinar is scheduled for 7:00 PM on June 23, with Yanni Angelakos, Head of Investment Insights at Nasdaq. Title: Macro Shocks vs. AI Tailwinds – a Delicate Balancing Act for US Markets. Registration link below:
Core Views and Recommendations
Asset Class | Core Views | Core Recommendations |
Equities | We remain cautious on global equities given a combination of tariffs, geopolitical risk and extreme market concentration (related to AI). In particular, the Iran oil shock adds another layer of macro uncertainty by pushing inflation higher, dampening growth and raising policy challenges. | Underweight equities in global asset allocation See our All ETF Model Portfolio below. |
US Equities | We are cautious on US equities for the same reasons above (including the “Fed Wildcard”), compounded by valuation concerns. Within US equities, we maintain high conviction in the AI’s long-term, structural growth trajectory, despite concerns about macro uncertainty and concentration risk. We also favour well-managed, “true defensive” companies, which continue to demonstrate stability and resilience in an uncertain macro environment. We continue to like energy – both as a hedge against geopolitical risks and a key beneficiary of surging AI electricity demand. | Underweight US equities in global asset allocation (All ETF Model Portfolio) AI: AMZN, AVGO, META, MSFT, NVDA Defensives: BRK/B, JNJ, PG, WMT, XLP Energy: OXY, XLE See our US Stock Model Portfolio below. |
China Equities | We are also cautious on China due to continuing macro weakness (“China’s Growing Pains”), i.e, a subdued real estate market and sluggish domestic demand, coupled with external shocks and a lack of stimulus. Having said that, the Iran oil crisis may be a blessing in disguise for China, as it could amplify Beijing’s manufacturing edge and supply chain dominance, thus benefiting industrial production and exports. Within China equities, we also favour AI, defensives and energy. | Overweight China equities in global asset allocation (All ETF Model Portfolio) AI: 0700.HK, 9988.HK, TSM Defensives: 0941.HK, 0005.HK Energy: 0857.HK, 300750.SZ / 3750.HK Others: 0027.HK, 0175.HK, 6690.HK, 9961.HK See our China Stock Model Portfolio below. |
Fixed Income | Bonds remain an essential asset class in a multi-asset portfolio, offering stable income, capital preservation, and diversification. Current bond yields also remain attractive relative to long-term inflation expectations. However, the US fiscal imbalance and the related de-dollarisation trend could be potential game changers for fixed income investing. In addition, both the Fed policy and the new Fed chair are wildcards, adding to market uncertainty in 2026. | Overweight bonds in global asset allocation (All ETF Model Portfolio). We have changed our Core Recommendation from intermediate-term (5-7 years) IG bonds to short-duration (<3 years) bonds. Build a currency-diversified fixed income portfolio, incorporating local currency and FX hedged bonds or bond funds. See Appendix E for UOB’s currency views. |
Commodities | We expect de-dollarisation to continue in 2026 and beyond and view gold as a top beneficiary of this long-term trend. | Overweight gold in global asset allocation (All ETF Model Portfolio). |
CIO Commentary
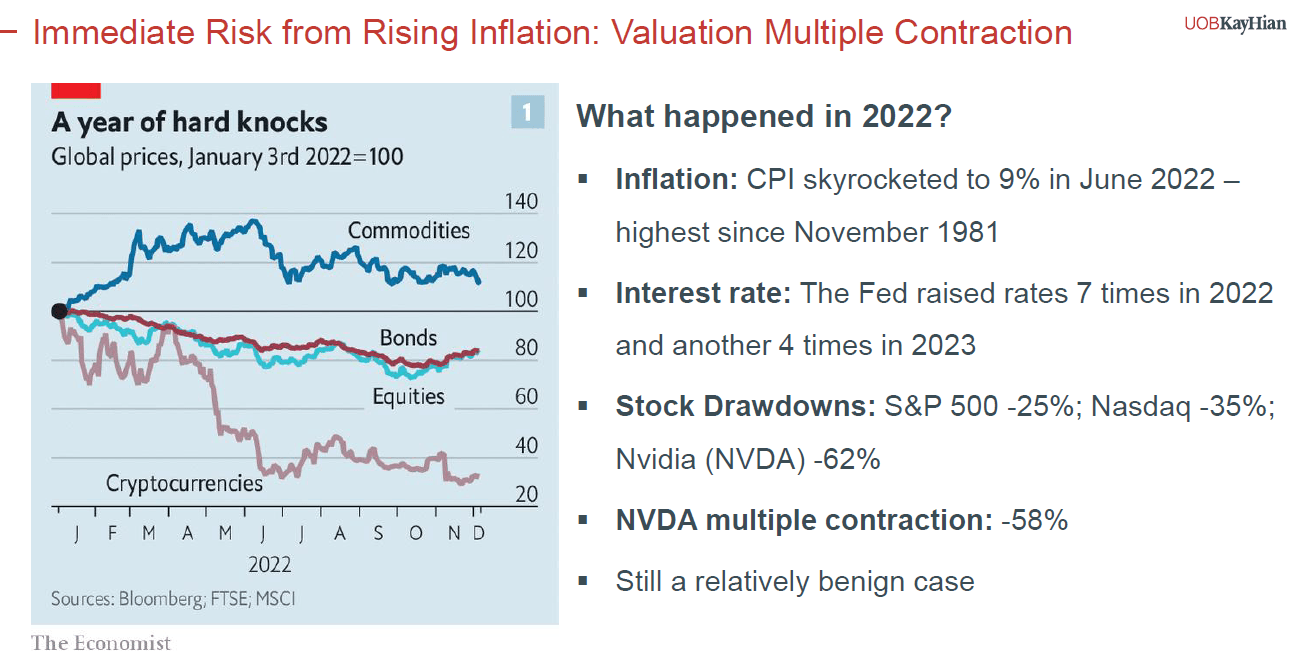
The Iran war is yet to end; the fight against inflation has already begun. Australia has been the most aggressive in raising interest rates so far, by three times YTD and twice since the war outbreak, for a total of 75 bps. Meanwhile, the European Central Bank (ECB) is widely expected to raise rates for the first time in three years in response to the Iran oil shock. The US is falling behind, with the first Fed rate hike expected only in December 2026.
Rate hikes are not universally negative for equities. However, caution is still warranted for the following reasons:
The largest oil shock in history. With the Strait of Hormuz still closed and a major share of global oil supply offline, the International Energy Agency (IEA) estimates an accumulative supply loss of 12 million barrels per day (mb/d) from the Middle East – making this the largest oil disruption in history. Worst yet, a significant drawdown in oil inventories continues, with the US commercial crude stocks now 3% below the five-year seasonal average (a big deal) and Strategic Petroleum Reserves (SPR) dwindling to 357 million barrels (lowest in over four decades). All such data points suggest further upside to oil prices and higher inflation pressures if the crisis continues.
Inflation entering the second wave. Around the world, oil-driven inflation is not only confirmed but also broadening across nearly all sectors. This is evident in the latest US CPI data (see US Equities section below), where fuel inflation is now spilling over to food, shelter and travel. The contagion makes inflation even stickier, pushing the Fed toward a more hawkish stance. The probability of a Fed rate hike by year-end has surged to 72% from 45% a week ago, according to the CME FedWatch.
Unprecedented market complacence. Despite recent volatility, stock markets continue to downplay inflation and policy risks. As a matter of fact, all major markets are trading above their Feb 28 levels – when the Iran war first began – without properly accounting for the macro headwinds. Some markets, including Korea and Japan, even seem bubble-like, propelled by strong AI momentum. Granted, inflation may not have any direct impact on AI industry fundamentals. However, history shows that a valuation multiple contraction becomes inevitable in a rising rate environment, especially for high-growth, high PE stocks.
Such multiple contractions are already happening in the form of “flash crashes” recently. On May 12, the S&P 500 collapsed on a hotter-than-expected CPI print, only to recover within hours as dip-buyers stepped in. Last Friday (June 5), the market tumbled again on strong jobs data, with several AI-related stocks down double-digits in a single day.
We expect these volatility spikes to continue, as the market oscillates between rate‑driven pullbacks (top-down) and AI‑driven rebounds (bottom-up). Sustained macro repricing risk will likely kick in around September – a few months before the expected Fed rate hike in December. This is precisely why we remain cautious in the medium term.
Asset Allocation (All ETF Model Portfolio)
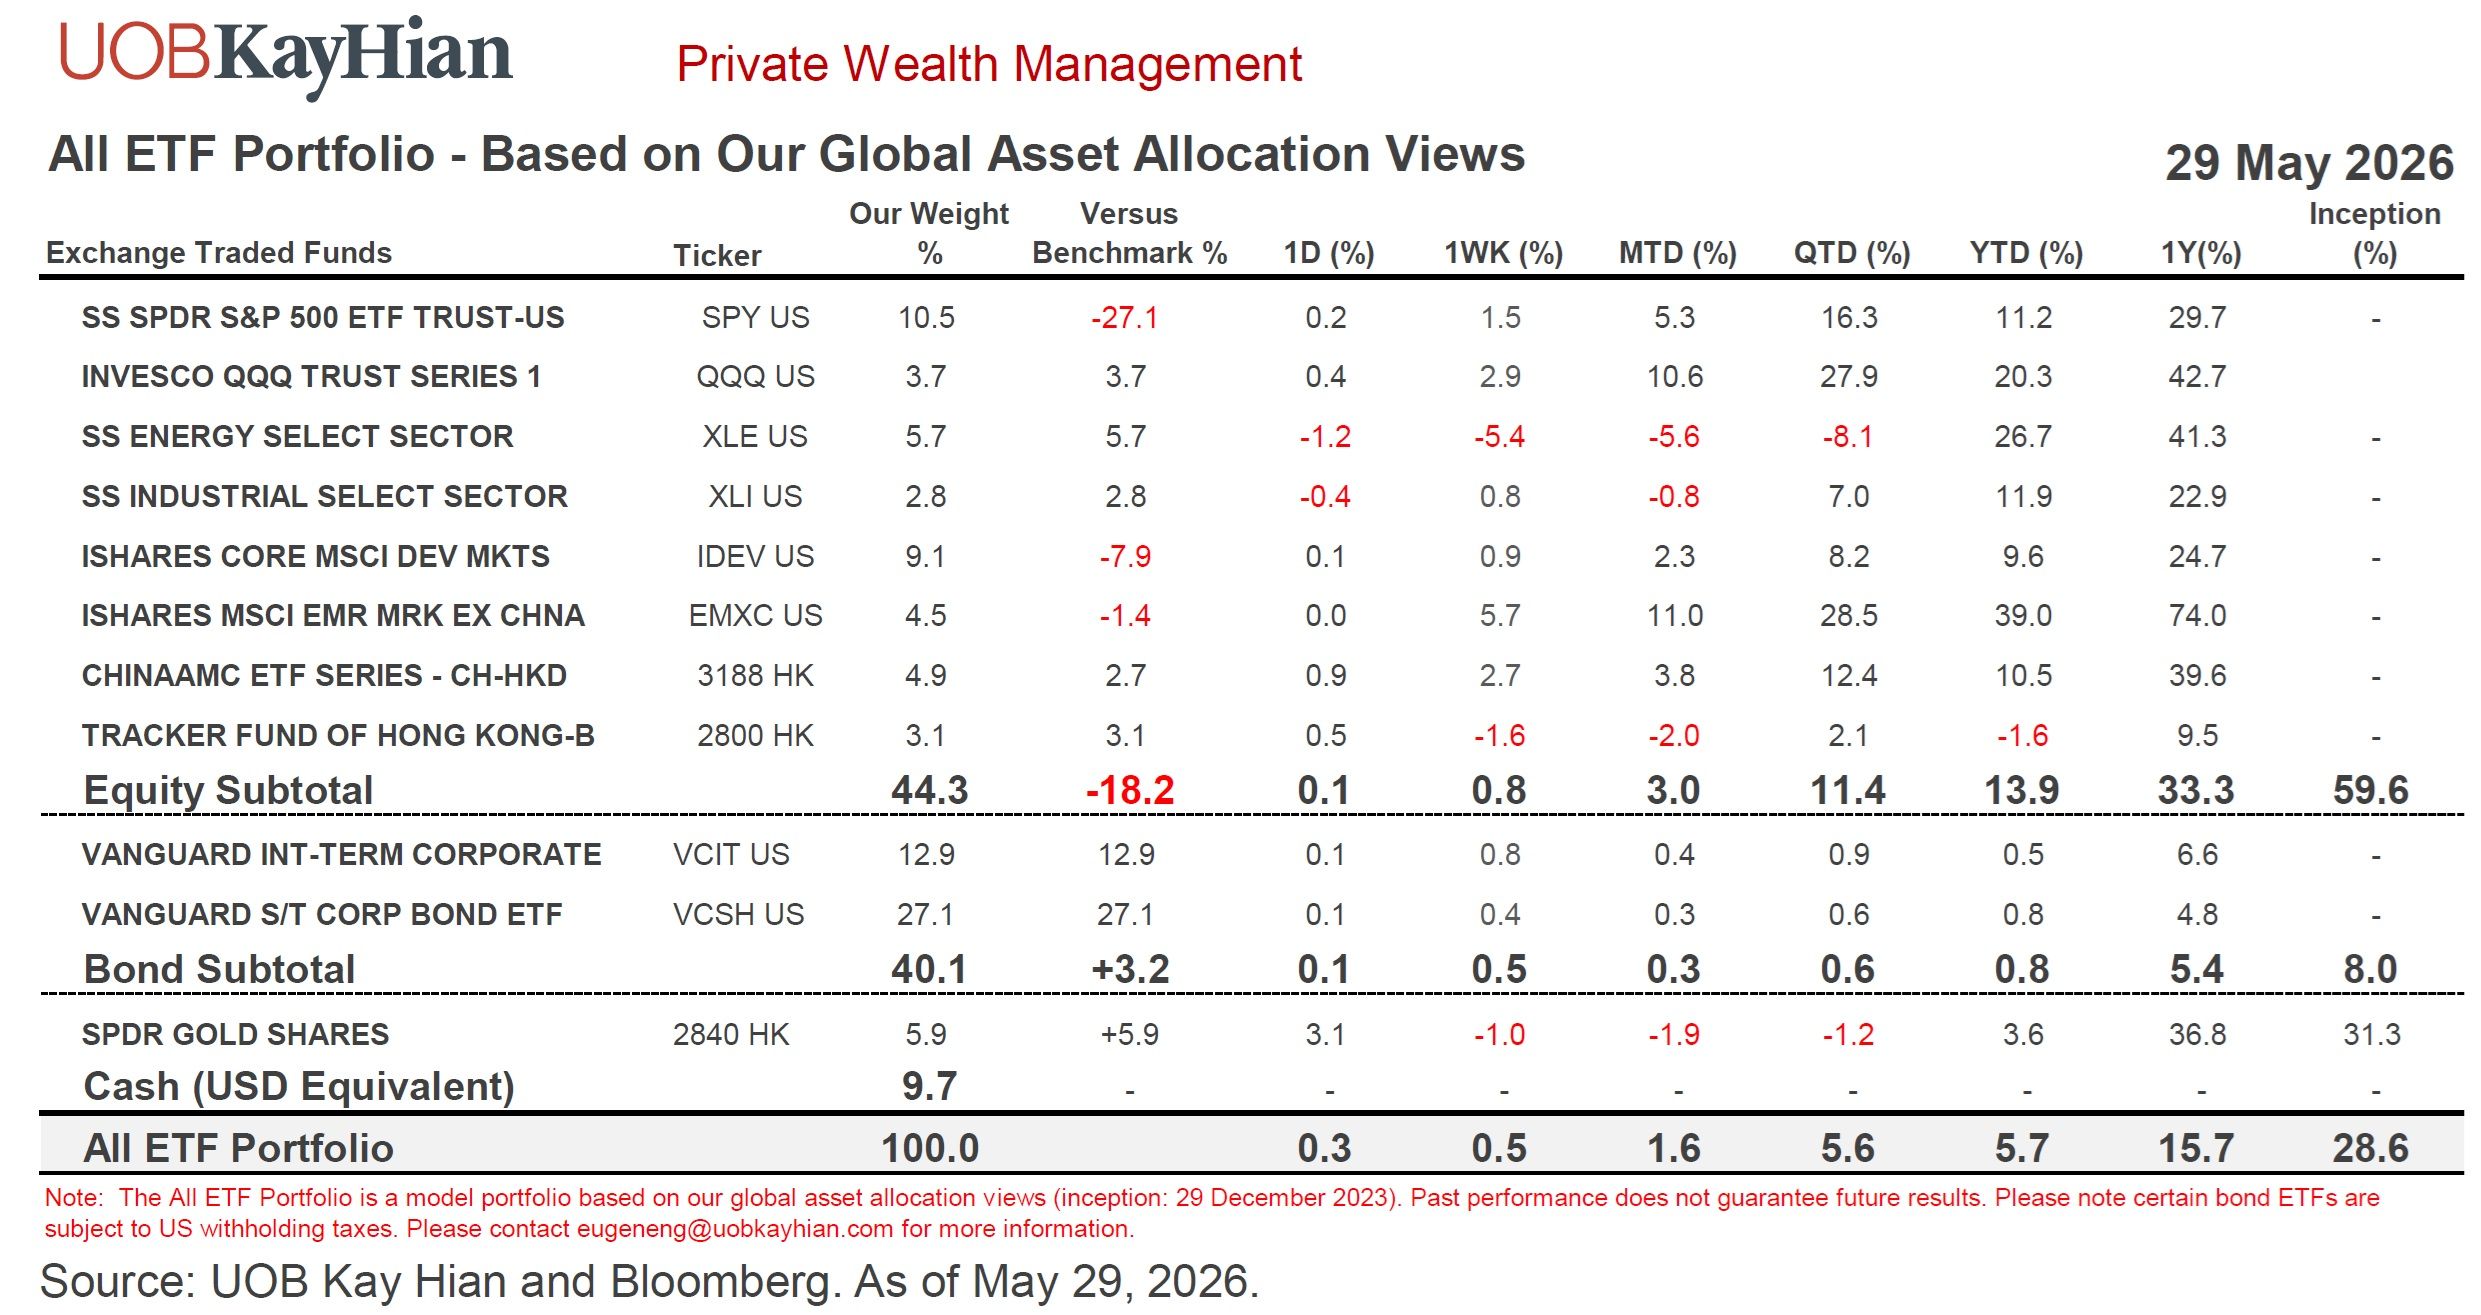
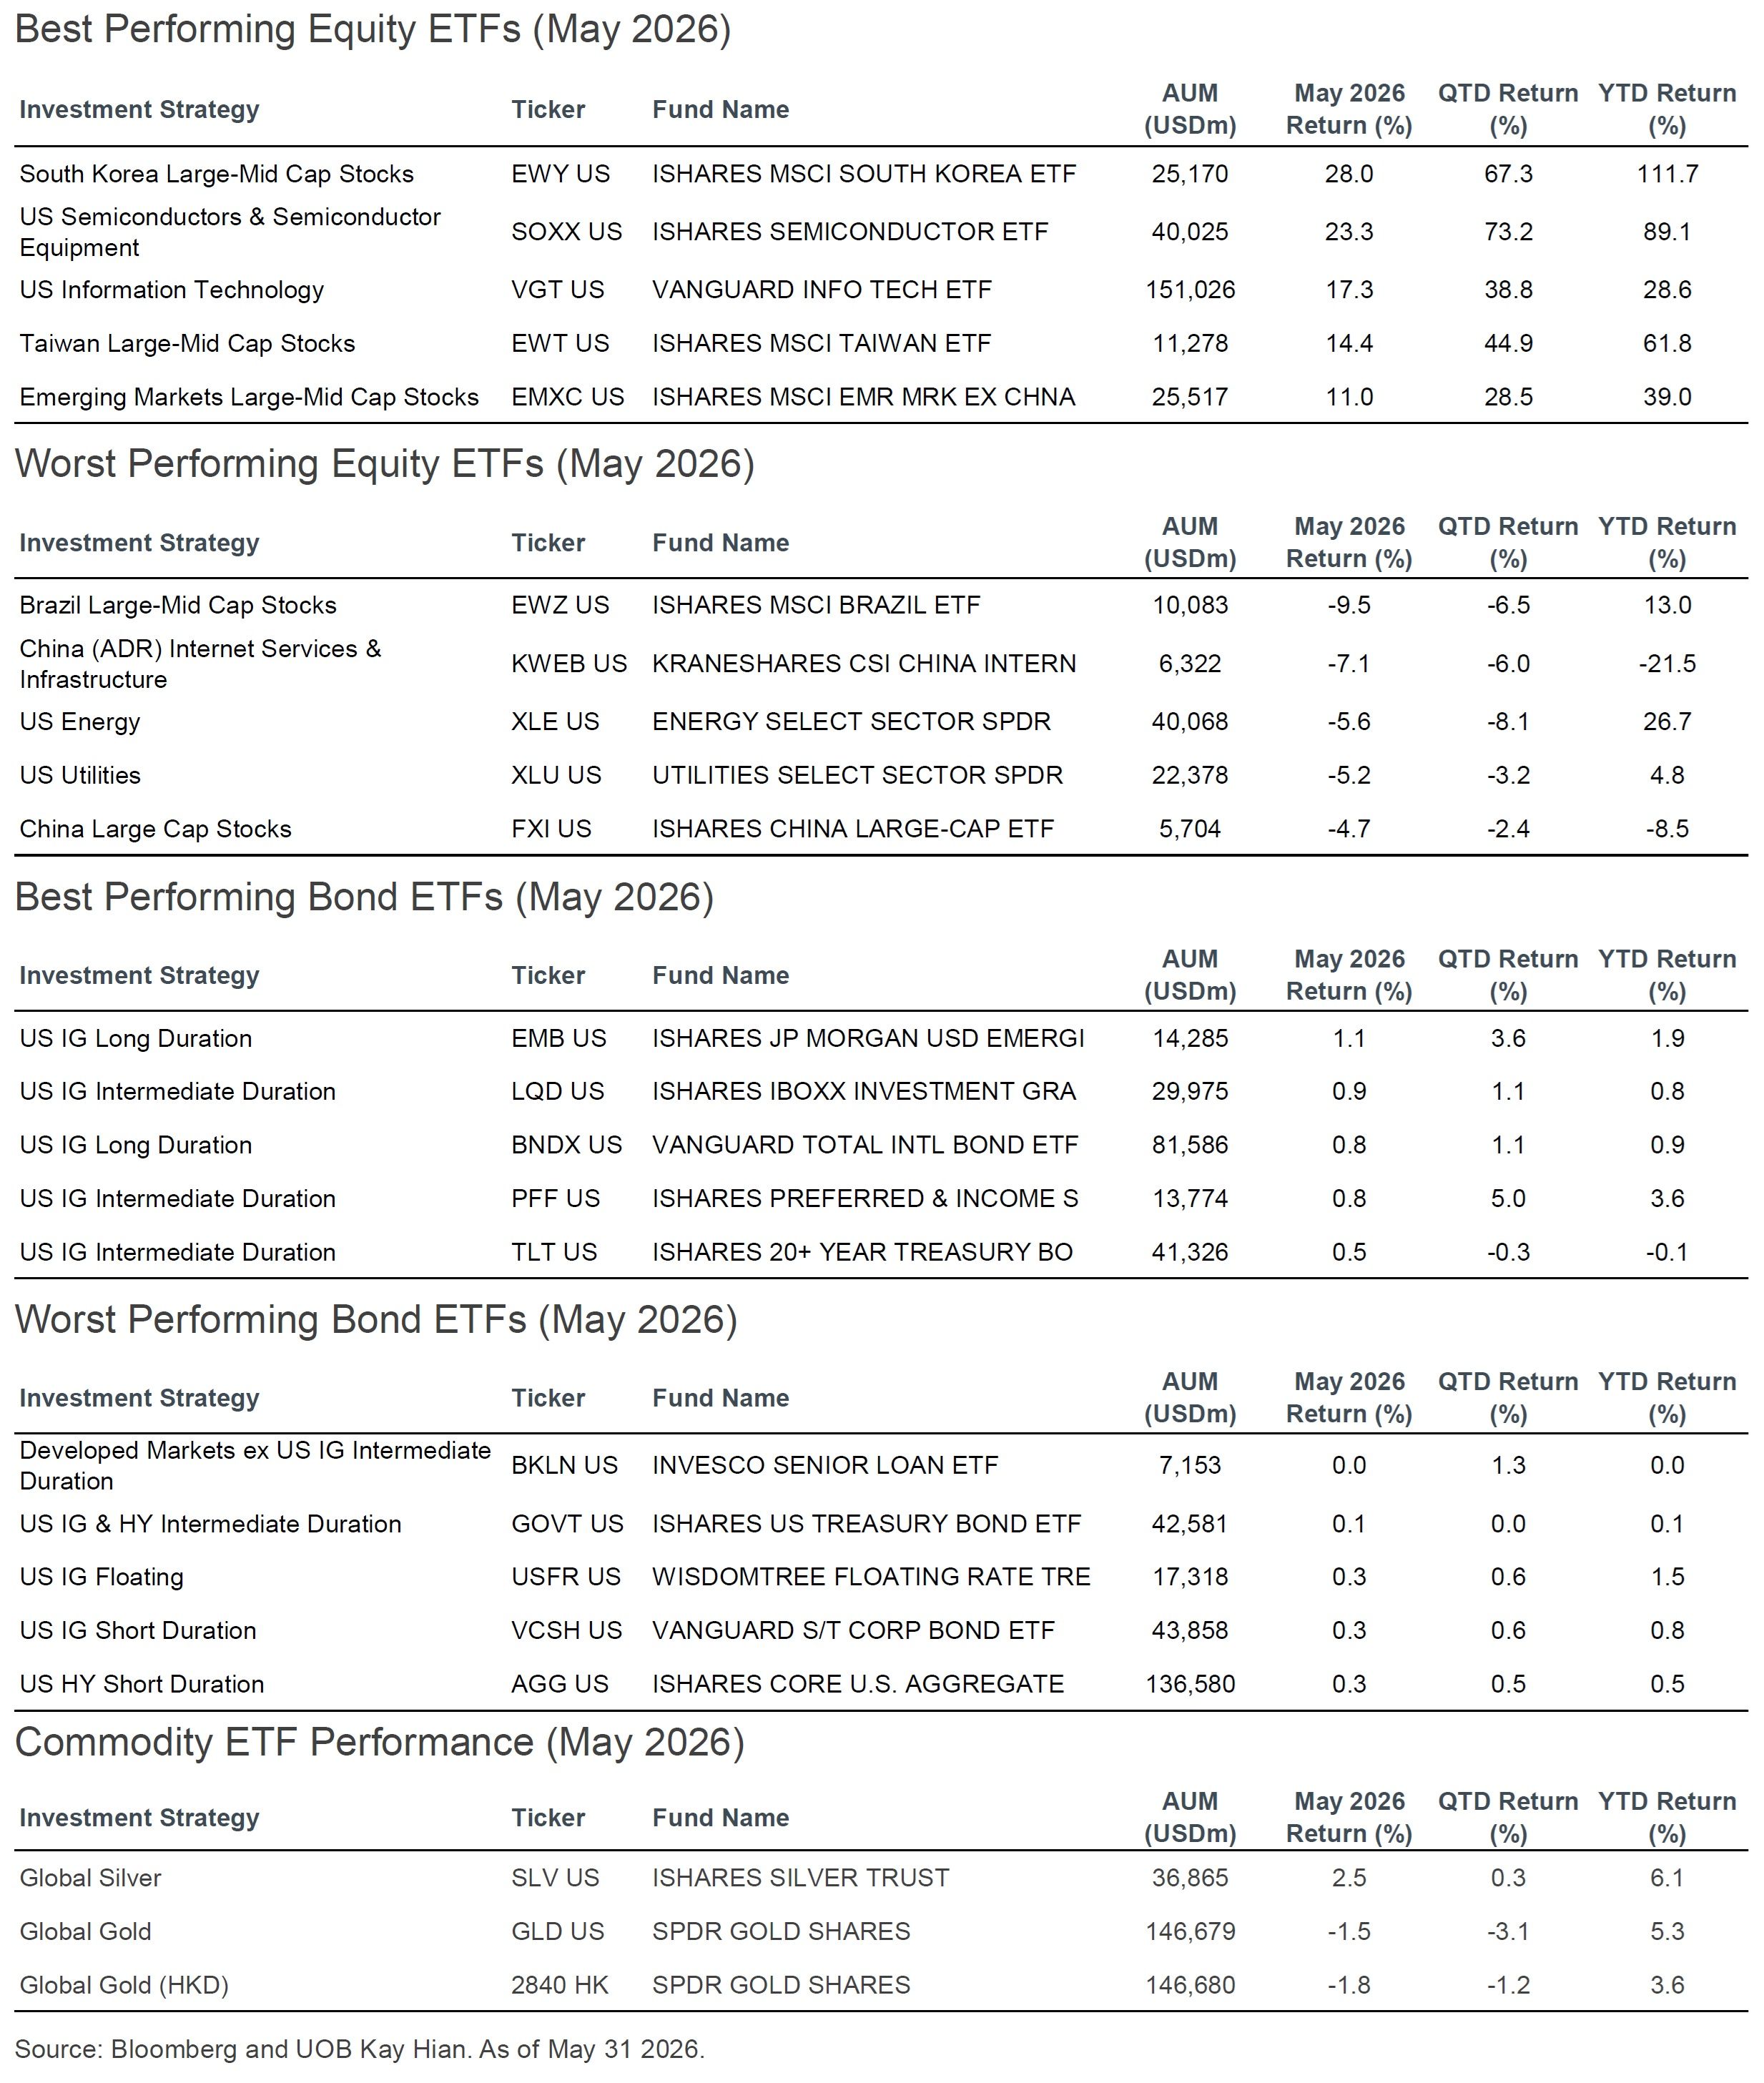
Our All ETF Portfolio for global asset allocation gained 1.6% in May, bringing the YTD return to 5.7%. Performance was mainly driven by strong gains in Nasdaq 100 (QQQ) +10.6%, EM ex-China (EMXC) +11.0% and S&P 500 (SPY) +5.3%, as geopolitical pressures appeared to ease.
Equities remain underweight (44.3% vs. 62.5%). We took profits in equities amid the market rebound in May, thus reducing our equity exposure from 48.5% to 44.3%.
US equity underweight (22.7% vs. 37.9%). We trimmed exposures to the S&P 500 (SPY) and Nasdaq 100 (QQQ), which gained 5.3% and 10.6% respectively in May, while adding to US Energy (XLE) following the May correction. XLE has been a short-term detractor, down 5.6% last month and off 8.1% QTD, but still up an impressive 26.7% YTD.
Developed Markets ex-US underweight (9.1% vs. 17.0%). DM ex-US (IDEV) contributed positively with a 2.3% return in May and a 9.6% return YTD. We cut exposure here due to the region’s greater vulnerability to the oil shock, including countries like Japan, Germany and Italy.
Emerging Markets ex-China equal weight (4.5% vs. 5.9%). EM ex-China (EMXC) was one of the strongest contributors, rising 11.0% in May and 39.0% YTD. We trimmed exposure to lock in gains after the strong run-up.
Fixed income slightly overweight (40.1% vs. 36.9%). Fixed income is also subject to macro and policy risks. Yet, it continues to provide relatively stable returns, up 0.3% in May and 0.8% YTD.
Gold remains overweight (5.9% vs. 0.0%). Gold (2840 HK) was down 1.9% in May but remained positive YTD at +3.6%. We continue to view gold as a portfolio diversifier and hedge against geopolitical risk, currency volatility and the longer-term de-dollarisation trend.
Cash stands at 9.7%. The cash buffer provides flexibility to buy on dips should market volatility create attractive entry points. As noted earlier, we expect macro-driven flash crashes to continue.
Equities
US Equities
Evidence of second-wave inflation continues to build: April CPI rose 3.8% yoy, beating expectations and showing signs of higher prices spreading beyond energy. May non-farm payrolls came in stronger-than-expected at 172K, more than double the consensus estimates. On both occasions (May 12 and June 5), US stocks tumbled with no major fundamental changes but on renewed rate hike fears. The CME FedWatch Tool now shows a 72% probability of a rate hike by year-end, up from 45% a week ago. We have been warning about a macro-driven multiple contraction for some time. It is finally happening.
Despite top-down concerns, we expect the S&P 500 to consolidate and drift higher from now till September with support from strong AI momentum (AI capex +83% in 2026) and robust earnings growth (+23% in FY2026). Beyond September, however, we think risks will tilt to the downside as markets begin to price in rate hikes (if any), the new Fed chair's six-month mark, the midterm election, and 2027 earnings projections from a high base. We remain cautious.
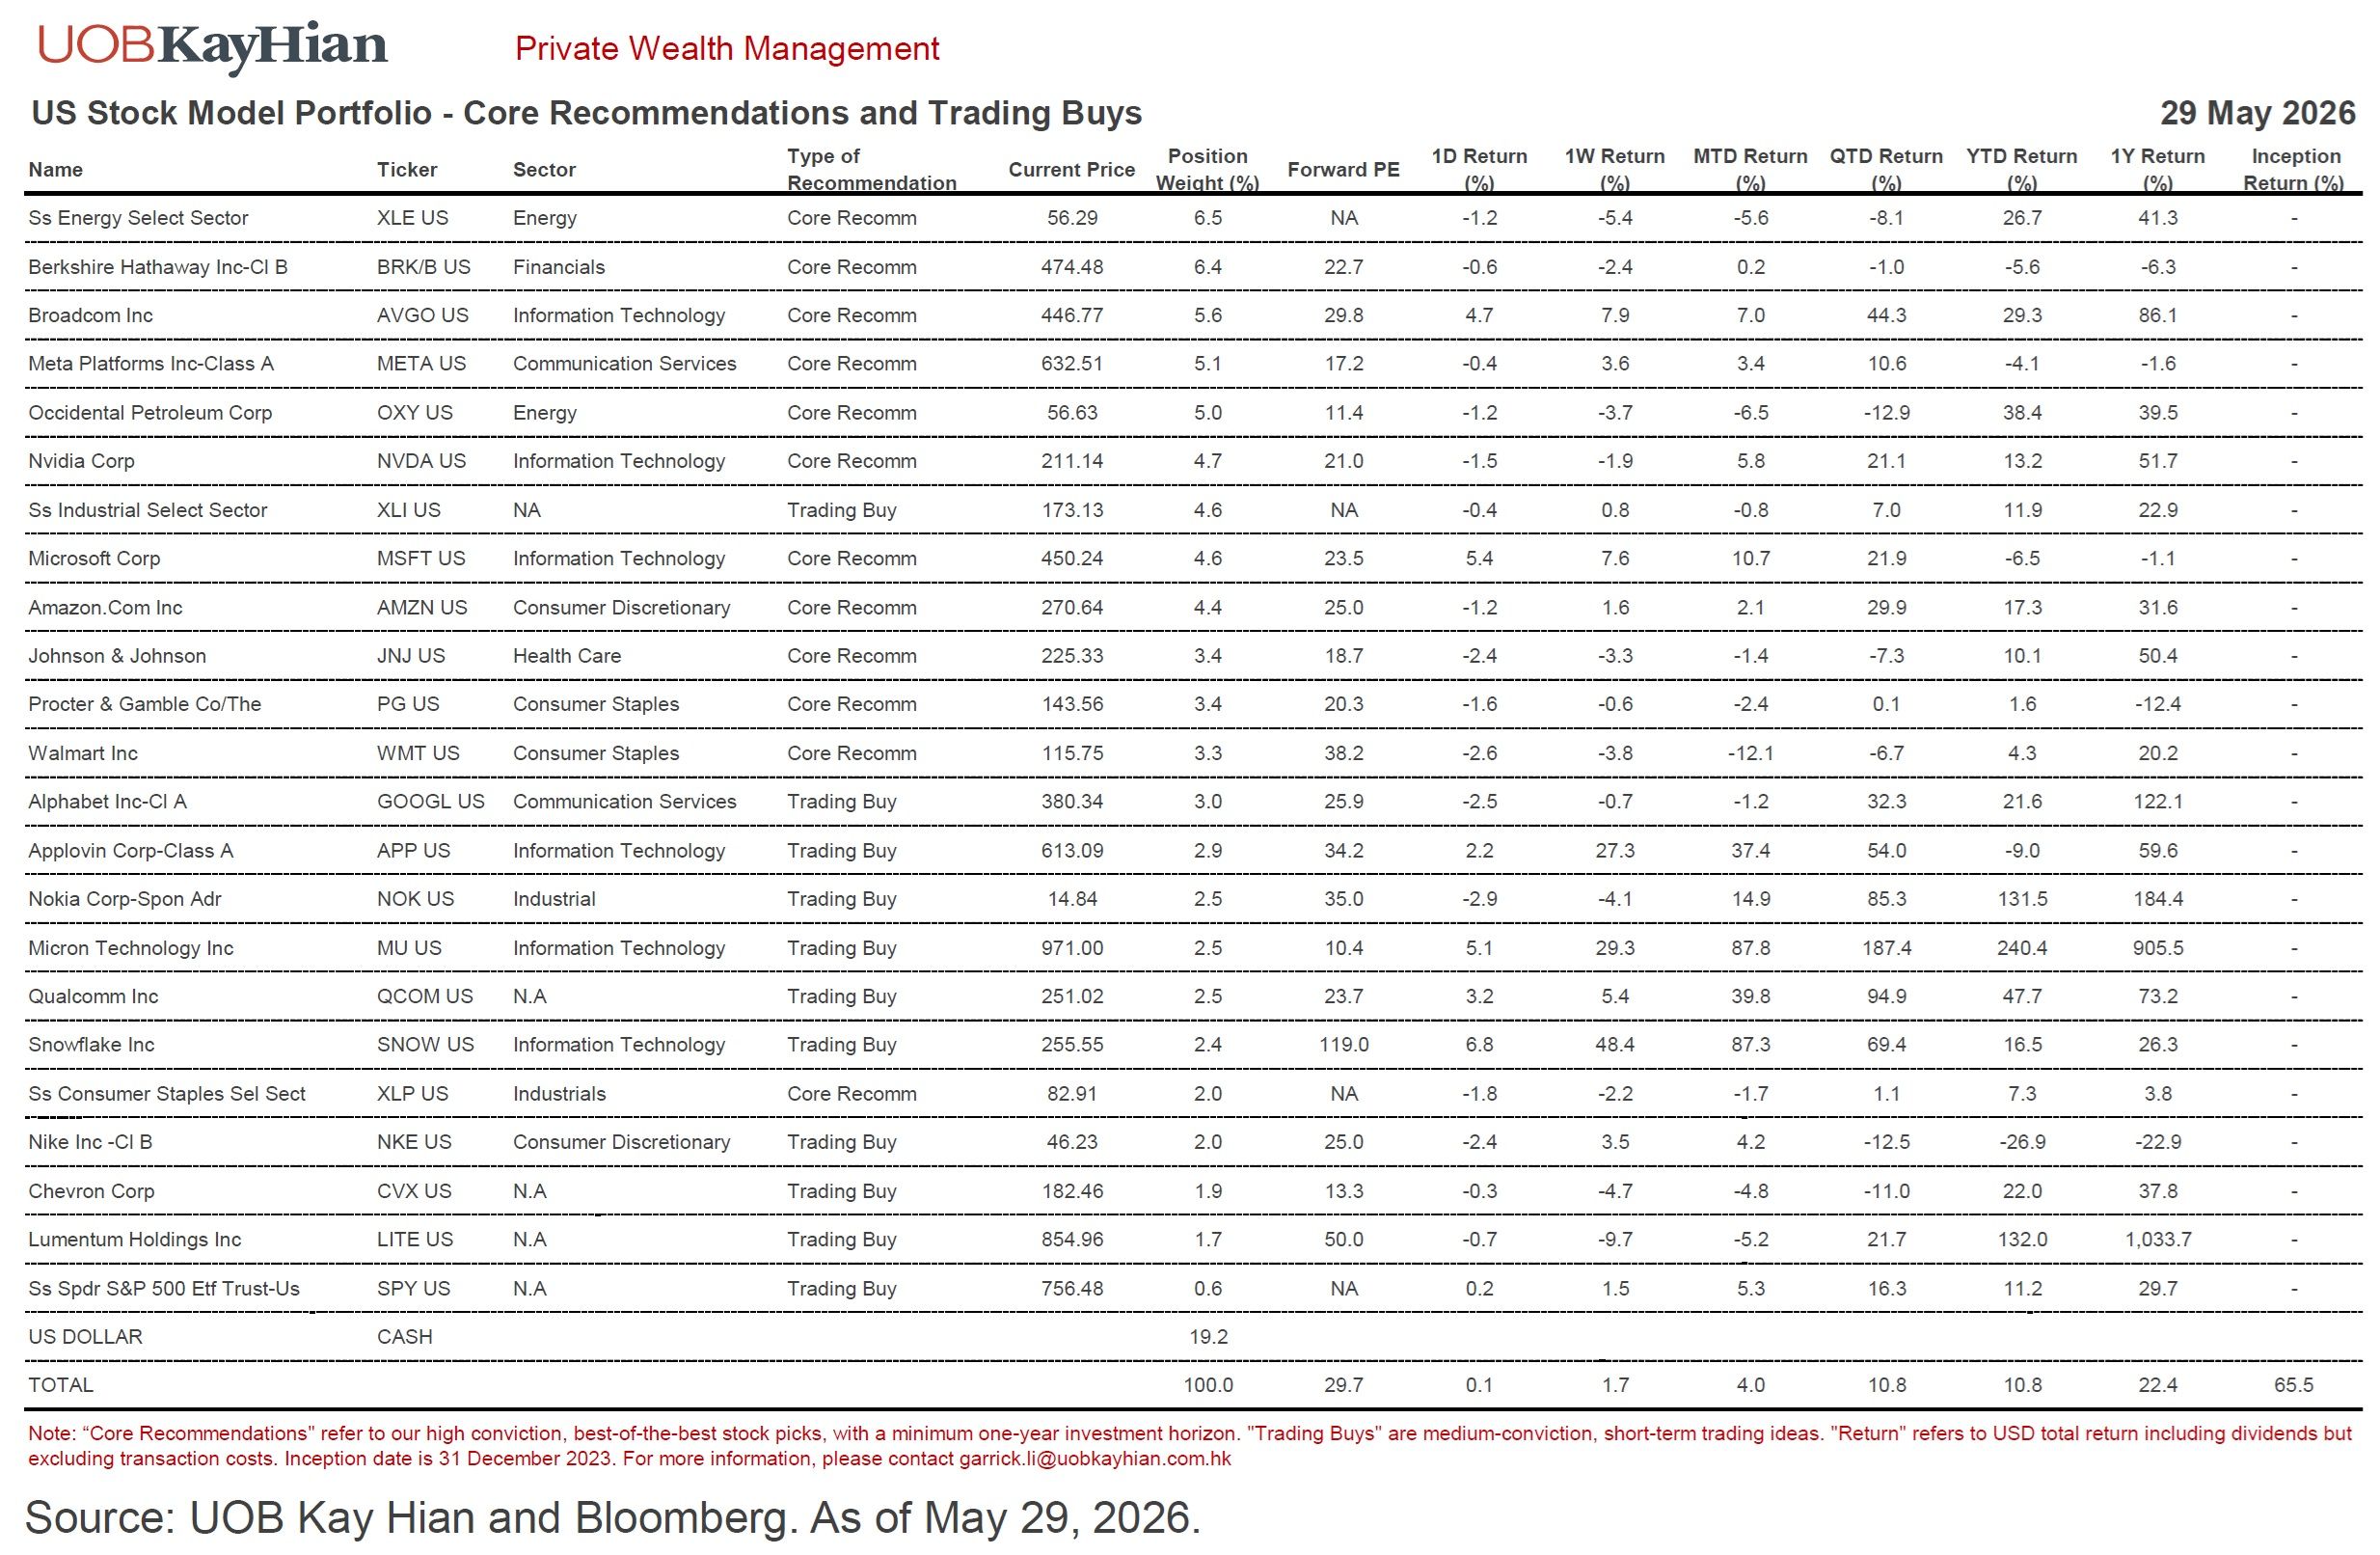
Our US Stock Model Portfolio advanced 4.0% in May and 10.8% YTD, slightly underperforming S&P 500 (SPY +5.3% MTD; 11.2% YTD). Gains were led by tech names like Micron (+87.8%), Snowflake (+87.3%) and Applovin (+37.4%), which more than offset the weakness in our Consumer Staples and Energy holdings.
Cash dropped from a peak of 30% to 19.2% as tech stocks grew within the portfolio, raising the total equity exposure. We entered new positions in Lumentum (LITE) and Qualcomm (QCOM) and added to existing positions in Berkshire (BRK/B) and Industrials (XLI). Meanwhile, we trimmed Consumer Staples (XLP), Nvidia (NVDA), Applovin (APP) and Broadcom (AVGO).
Top 3 performers: MU +87.8%, SNOW +87.3%, APP 37.4%,
Bottom 3 performers: WMT -12.1%, OXY -6.5%, XLE -5.6%.
Nvidia (NVDA) reported another strong set of results, with both revenue and guidance exceeding elevated buyside expectations. 1Q revenue grew 85% yoy to USD 81.6 bn, exceeding buy-side estimates of USD 81 bn. 2Q guidance also came in ahead of expectations. NVDA’s strong results have again validated its dominance in AI data centres.
Broadcom (AVGO) reported mixed results, with revenue beating consensus estimates but missing elevated buy-side expectations. Its AI semi segment grew +143% yoy to USD 10.8 bn, driven by robust demand for AI ASICs and networking solutions. The software business is also a bright spot, with growth accelerating to 8% yoy and guidance pointing to a 31% jump next quarter, as more CPU-intensive inference workloads support VMware pricing. Despite a 13% share price pullback post-earnings, our long-term thesis on AVGO remains intact, with its ASIC and networking businesses well positioned to deliver multi-year growth.
Walmart (WMT)’s FY1Q2027 results came largely in-line with expectations, with adjusted EPS rising 8.2% yoy. However, shares declined post results due to:
higher-than-expected fuel costs in delivery and fulfilment amid the Iran oil shock;
no increase to full-year guidance despite strong 1Q results
cautious management commentary on consumer spending, noting that lower-income shoppers are facing "financial distress."
We still view the reiterated full-year guidance as a positive signal, demonstrating WMT's ability to absorb higher fuel costs through its smart management, diversified revenue stream and scale advantage. Walmart remains a Core Recommendation and one of our "true defensive" holdings. The stock currently trades at 38x forward P/E with earnings expected to grow 11% in FY2027 and 13% in FY2028.
Must watch events in June: Microsoft Build 2026 San Francisco (Jun 2-3), US May Labor data (Jun 5), US May CPI (Jun 10), ECB Rate Decision (Jun 10-11), US May PPI (Jun 11), SpaceX IPO Debut (Jun 12), G7 Leaders’ Summit France (Jun 15-17), BOJ Rate Decision (Jun 15-16), Fed Rate Decision (June 16-17), Amazon Prime Day (Jun 23-26), Nvidia AGM (Jun 24). Earnings: AVGO (Jun 3), ORCL (Jun 10), MU (Jun 24), NKE (Jun 30). For more information, please see Appendix B.
China Equities
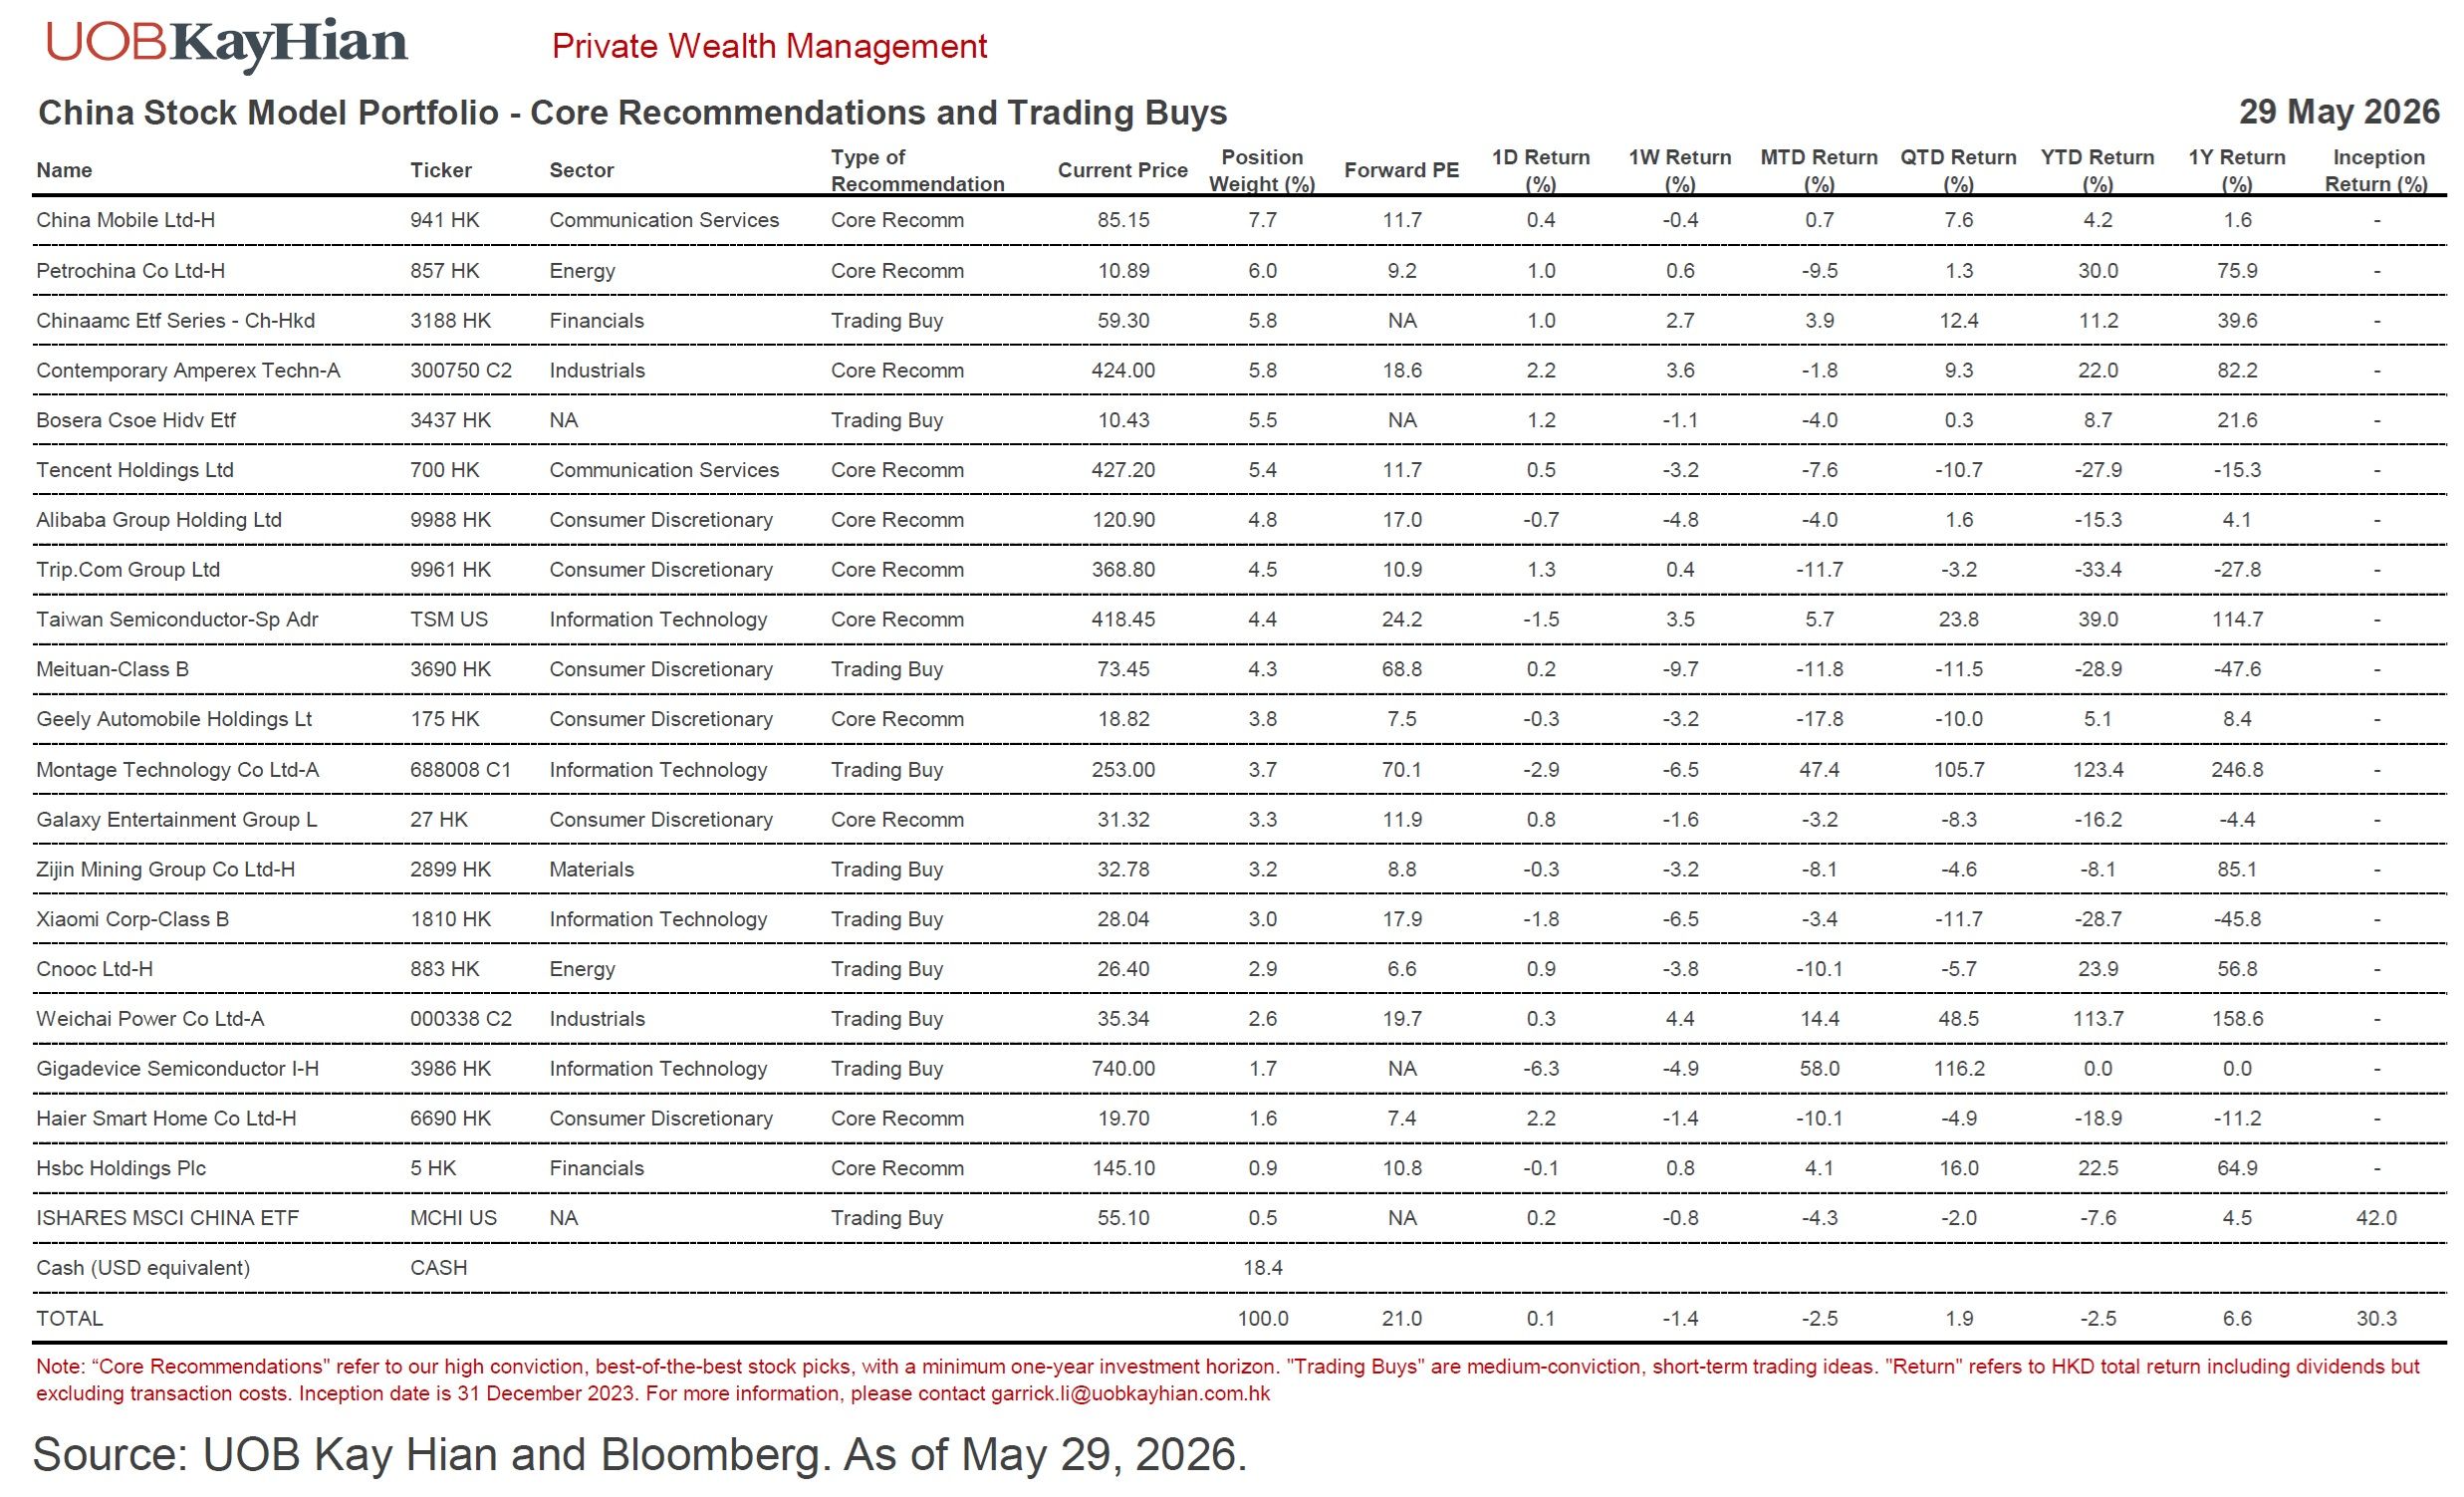
Our China Stock Model Portfolio fell 2.5% in May but still outperformed MSCI China (MCHI), which declined 4.3%. We also continue to beat the benchmark YTD (-2.5% vs MCHI -7.6%).
Cash increased marginally to around 18.4% as we net-sold stocks in May. We trimmed some TSMC (TSM) and CATL (300750.SZ) and bought Gigadevice (3986.HK) as a new position and added to China Mobile (0941.HK).
Top 3 performers: 688008.SZ +47.4%, 000338.SZ +14.4% and TSM +5.7%.
Bottom 3 performers: 0175.HK -17.8%, 3690.HK -11.8%, 9961.HK -11.7%.
Tencent (700.HK) missed earnings, with 1Q2026 revenue growth of +9%, slightly below expectations. A key debate is whether Tencent’s late entry into AI still allows it to catch up with its peers. If successful, it could drive a re-rating from ~13x to 20x PE. Recent developments are encouraging, as Tencent is reportedly preparing an AI agent launch in WeChat. Though the timing is still uncertain, Tencent is indeed making progress in its AI capabilities. Its Hunyuan (hy3) model has ranked among the top two on OpenRouter recently, despite being the first model by its new AI team.
Alibaba (9988.HK) also reported lower than expectedearnings, with 4QFY2026 revenue +3% yoy slightly missing consensus. Its Hong Kong shares showed resilience post-earnings on renewed AI optimism, with Alicloud revenue further accelerating to +38% yoy in the March quarter. Regarding the intense competitions in AI cloud and food delivery, Baba mentioned that:
Alicloud margin has actually expanded, supported by price hikes and a mix shift to higher-margin MaaS;
Quick commerce unit economy (UE) is on track for a turnaround in FY2027.
A key debate for Alibaba is whether its full-stack AI leadership – from T-head chips to Tongyi Qianwen models – can sustain cloud re-acceleration and drive a multiple re-rating. Though we remain mindful of core commerce headwinds from weak domestic consumption, we are impressed by Alibaba’s AI pricing power and inference efficiency gains. This remains the best full-stack AI player in China and our Core Recommendation,
Trip.com (9961.HK) remains our high conviction pick in Chinese Internet as the undisputed online travel platform (OTA) leader with about 55% market share in China and a dominant player in the high-end and business travel segments. Due to the regulatory overhang from a Chinese antitrust investigation, Trip.com trading at an undemanding 11.6x FY2026 P/E. Ahead of its 1Q2026 earnings (June 17 est date), our institutional analyst expects 14-15% yoy revenue growth to RMB 15.9 bn, with 81% gross margin – unchanged and anchored by surging international tourism. The company announced a strategic partnership with Galaxy Macau (June 4), signalling a compelling pivot to high-margin live events.
Must watch events in June: Computex Taipei (till Jun 5), China May Exports (Jun 9), China May CPI/PPI & TSMC May Monthly Sales (Jun 10), China May Vehicle Sales (Jun 11), Fed Rate Decision (June 16-17). Earnings: Meituan (June 1), Trip.com (Jun 17). For more information, please see Appendix B.
Fixed Income
Below is the CIO Summary from our latest Fixed Income Monthly (June 4, 2026), for Professional / Accredited Investors only. Ping benjamintan@uobkh.com if you’d like to receive the full report.
Competing macro forces put Warsh in a bind, reinforcing our call on the Fed Wildcard. Oil-driven inflation enters the second wave, while US consumption and corporate America remain resilient. Mixed macro data, coupled with a deeply divided Fed, presents unprecedented challenges for new Fed Chair Kevin Warsh.
Three longer-term forces keep yields high. The Fed Wildcard, fiscal expansions, and surging financing demand for AI capex all put upward pressure on Treasury yields. As a result, 4.5% may not be a reliable upper bound for 10-year Treasury yields.
Maintain our Core Recommendation on high-quality, investment-grade bonds with short durations (< 3 years). Tactical trading of intermediate durations around the 4.5% level should be approached with care.
This month’s bond highlight: taking profit in MEITUA 4.625% 2 Oct 2029.
Currencies
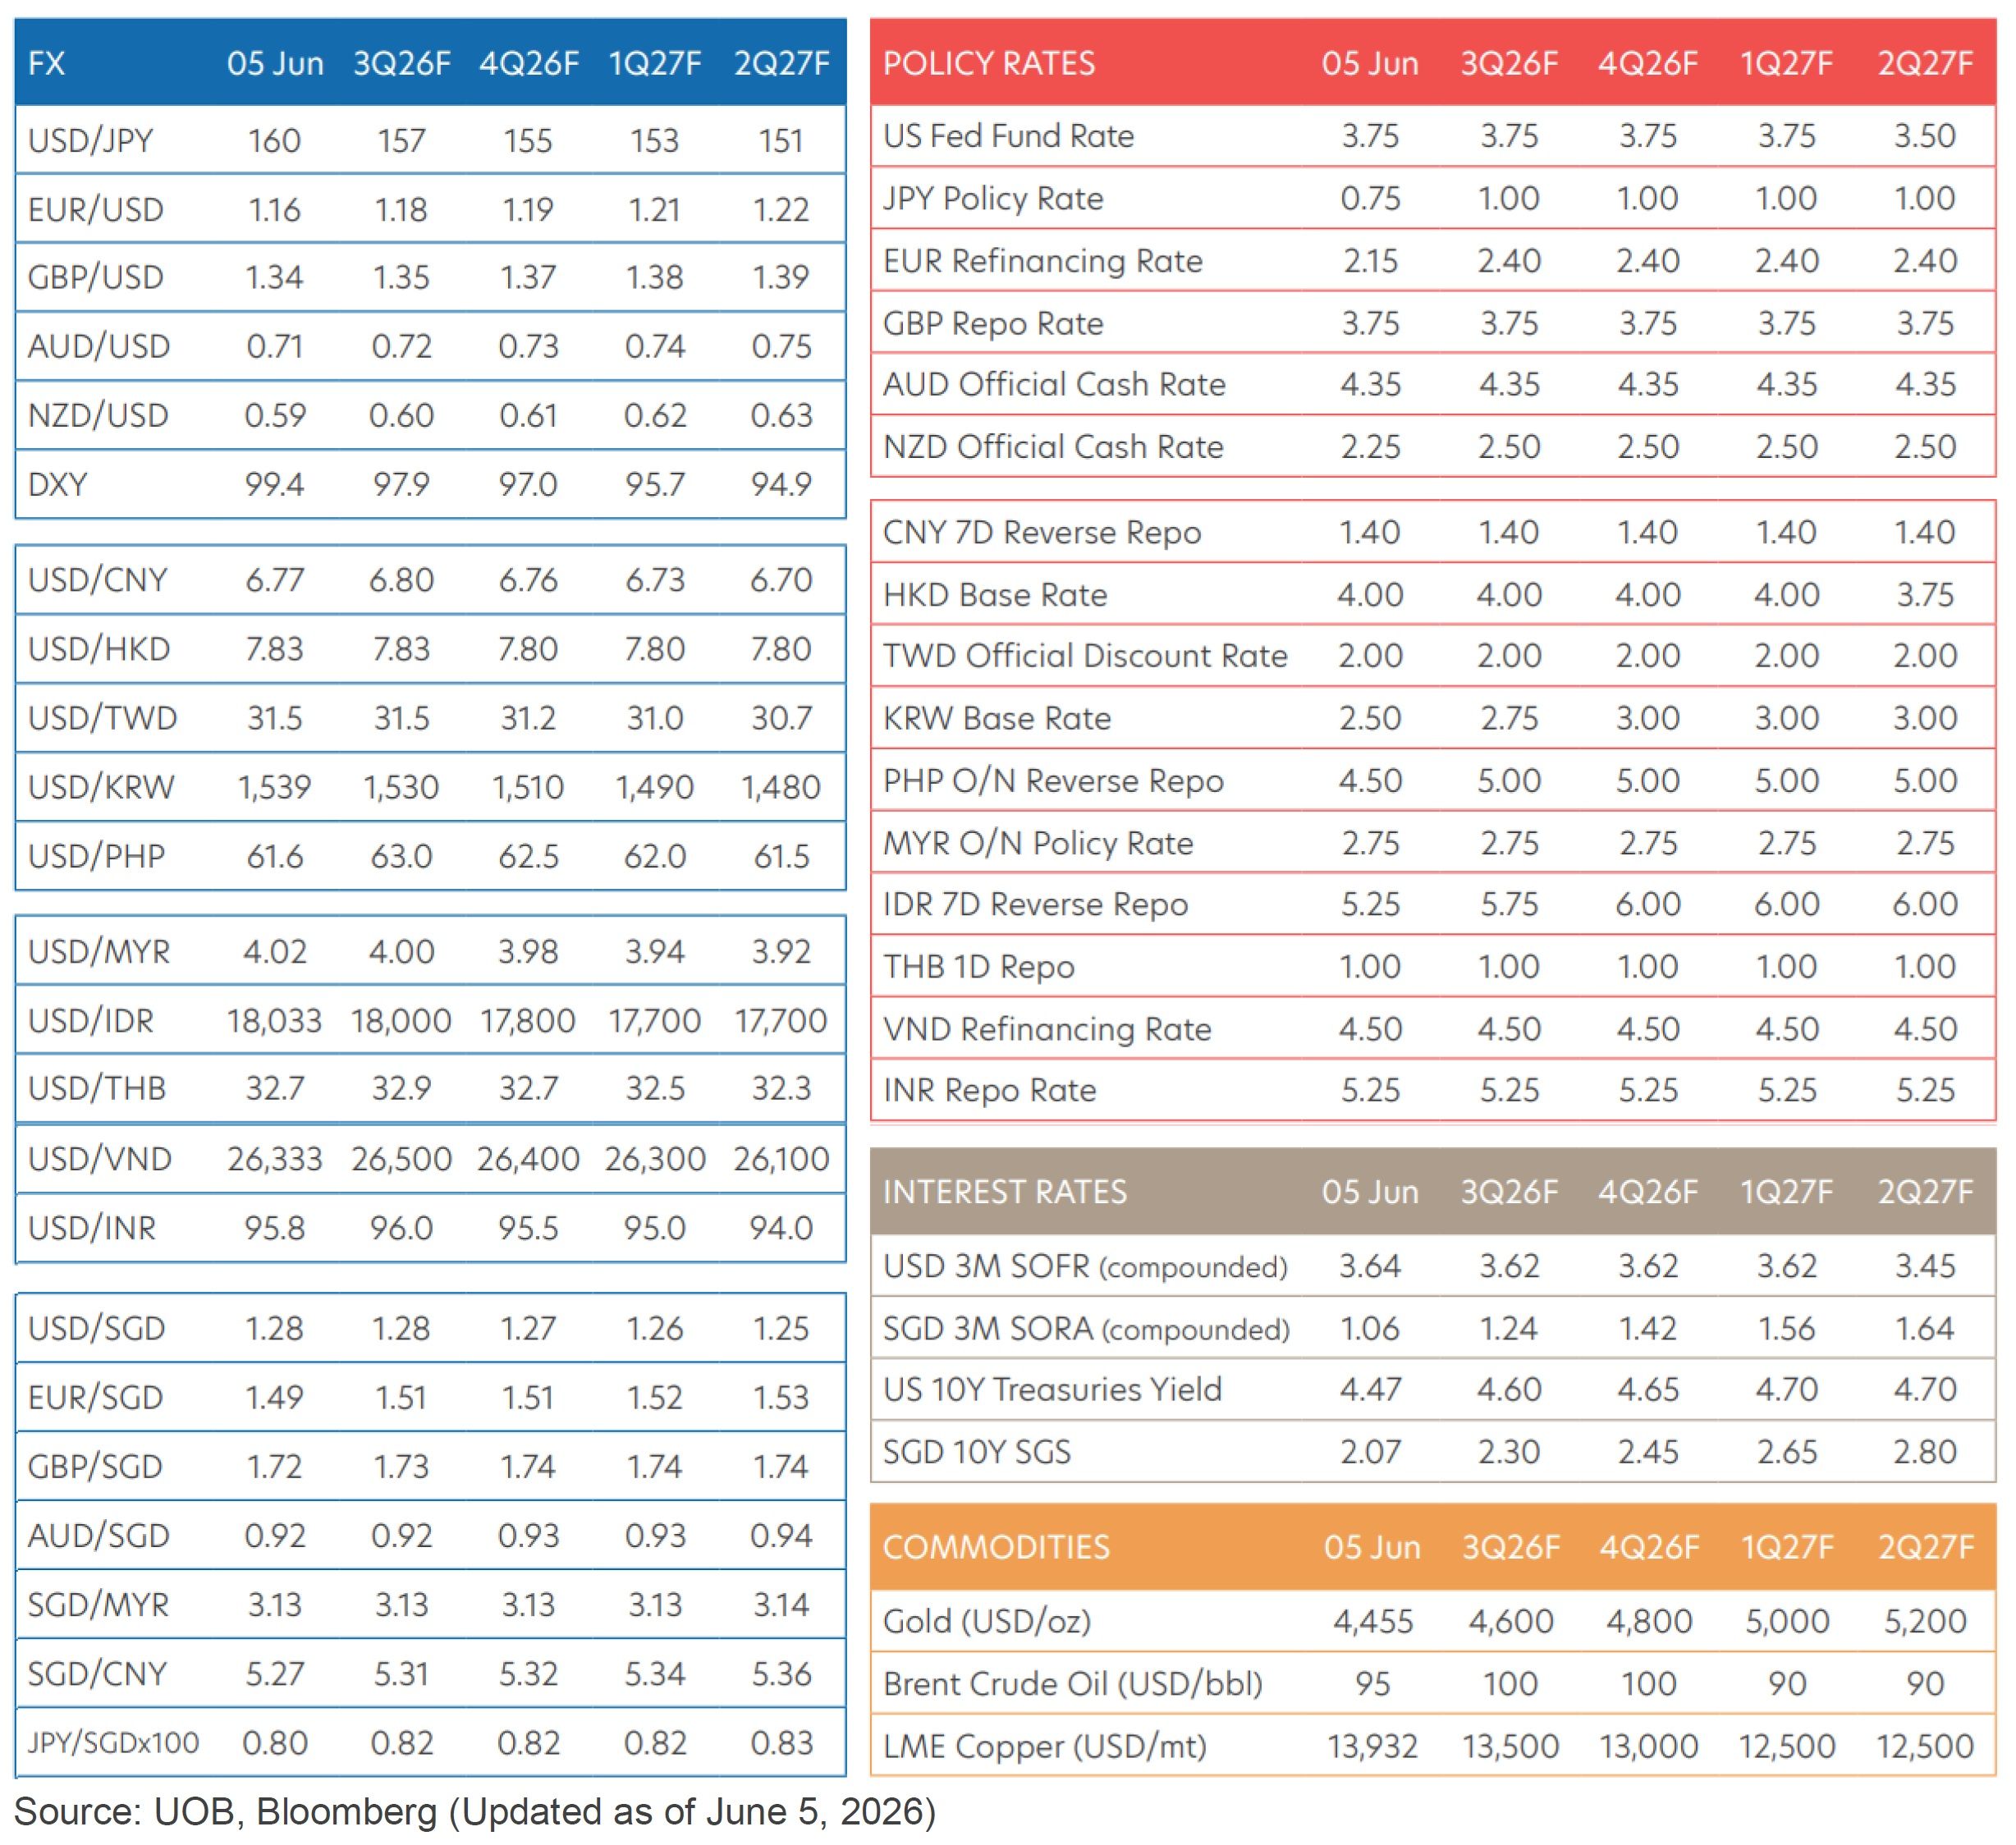
We rely on our associate UOB for currency views. Below are the latest insights from its Quarterly Global Outlook 3Q2026 (June 5, 2026). Please refer to Appendix E for UOB’s official forecasts on FX, interest rates and commodities. You can also access the full selection of UOB research on its research portal.
Major FX Strategy: Monetary policy to take over in 2H2026 as key driver
Looking ahead to 2H2026, our base case remains that diminishing geopolitical risk premia will erode a key pillar of USD support. In turn, market focus is likely to shift back toward monetary policy differentials. Our Fed view has notably pivoted less dovish relative to the pre-war baseline. Concurrently, select G10 central banks have already initiated tightening cycles. As such, we retain a medium-term bearish bias on the USD. The continued narrowing in US rate differentials versus G10 peers should act as a structural headwind for the USD. Consistent with this view, our updated DXY forecasts are still biased lower, at 97.9 in 3Q2026, 97.0 in 4Q2026, 95.7 in 1Q2027, and 94.9 in 2Q2027.
Risks to our USD outlook remain skewed to the upside should the closure of the Strait of Hormuz persist deeper into 2H2026. Under such a scenario, sustained high oil prices—potentially at or above USD120/bbl—would likely amplify second-round inflation effects, particularly through wages, services, and core components. This would present a material challenge for the Fed, limiting its ability to look through supply-driven price pressures. In turn, the policy narrative could shift more decisively towards the prospect of renewed tightening into year-end. Such a development (while not yet our base case) would represent a clear upside risk to the USD and necessitate a reassessment of our baseline expectation for a weaker dollar trajectory.
Asian FX Strategy: Recovery deferred as Hormuz risks linger on
We have consistently highlighted in prior publications that Asia FX remains disproportionately exposed to prolonged Middle East tensions. Since the onset of the Iran conflict, most regional currencies have weakened against the USD, with net energy importers—such as PHP, THB, INR and IDR—underperforming. The ongoing closure of the Strait of Hormuz, now into its fourth month, has intensified fiscal strains associated with securing energy supplies, particularly in economies with administered fuel pricing frameworks. Each additional day of disruption heightens inflation risks across the region, while macro buffers—including current account positions and FX reserve adequacy—have eroded in several cases.
On balance, we judge that a cautious stance remains warranted until there are clearer signs of normalisation in the Strait of Hormuz and a meaningful easing in regional inflationary pressures. Accordingly, we maintain a defensive bias on Asia FX into 3Q26 and push back the expected timing of a more sustained recovery to 4Q26. We expect CNY, MYR and SGD to stay resilient as they have thus far during the Middle East conflict, while TWD and KRW are expected to post a stronger recovery due to sustained AI tailwinds. On the other hand, PHP, IDR and INR are expected to underperform and stay near record lows against the USD.
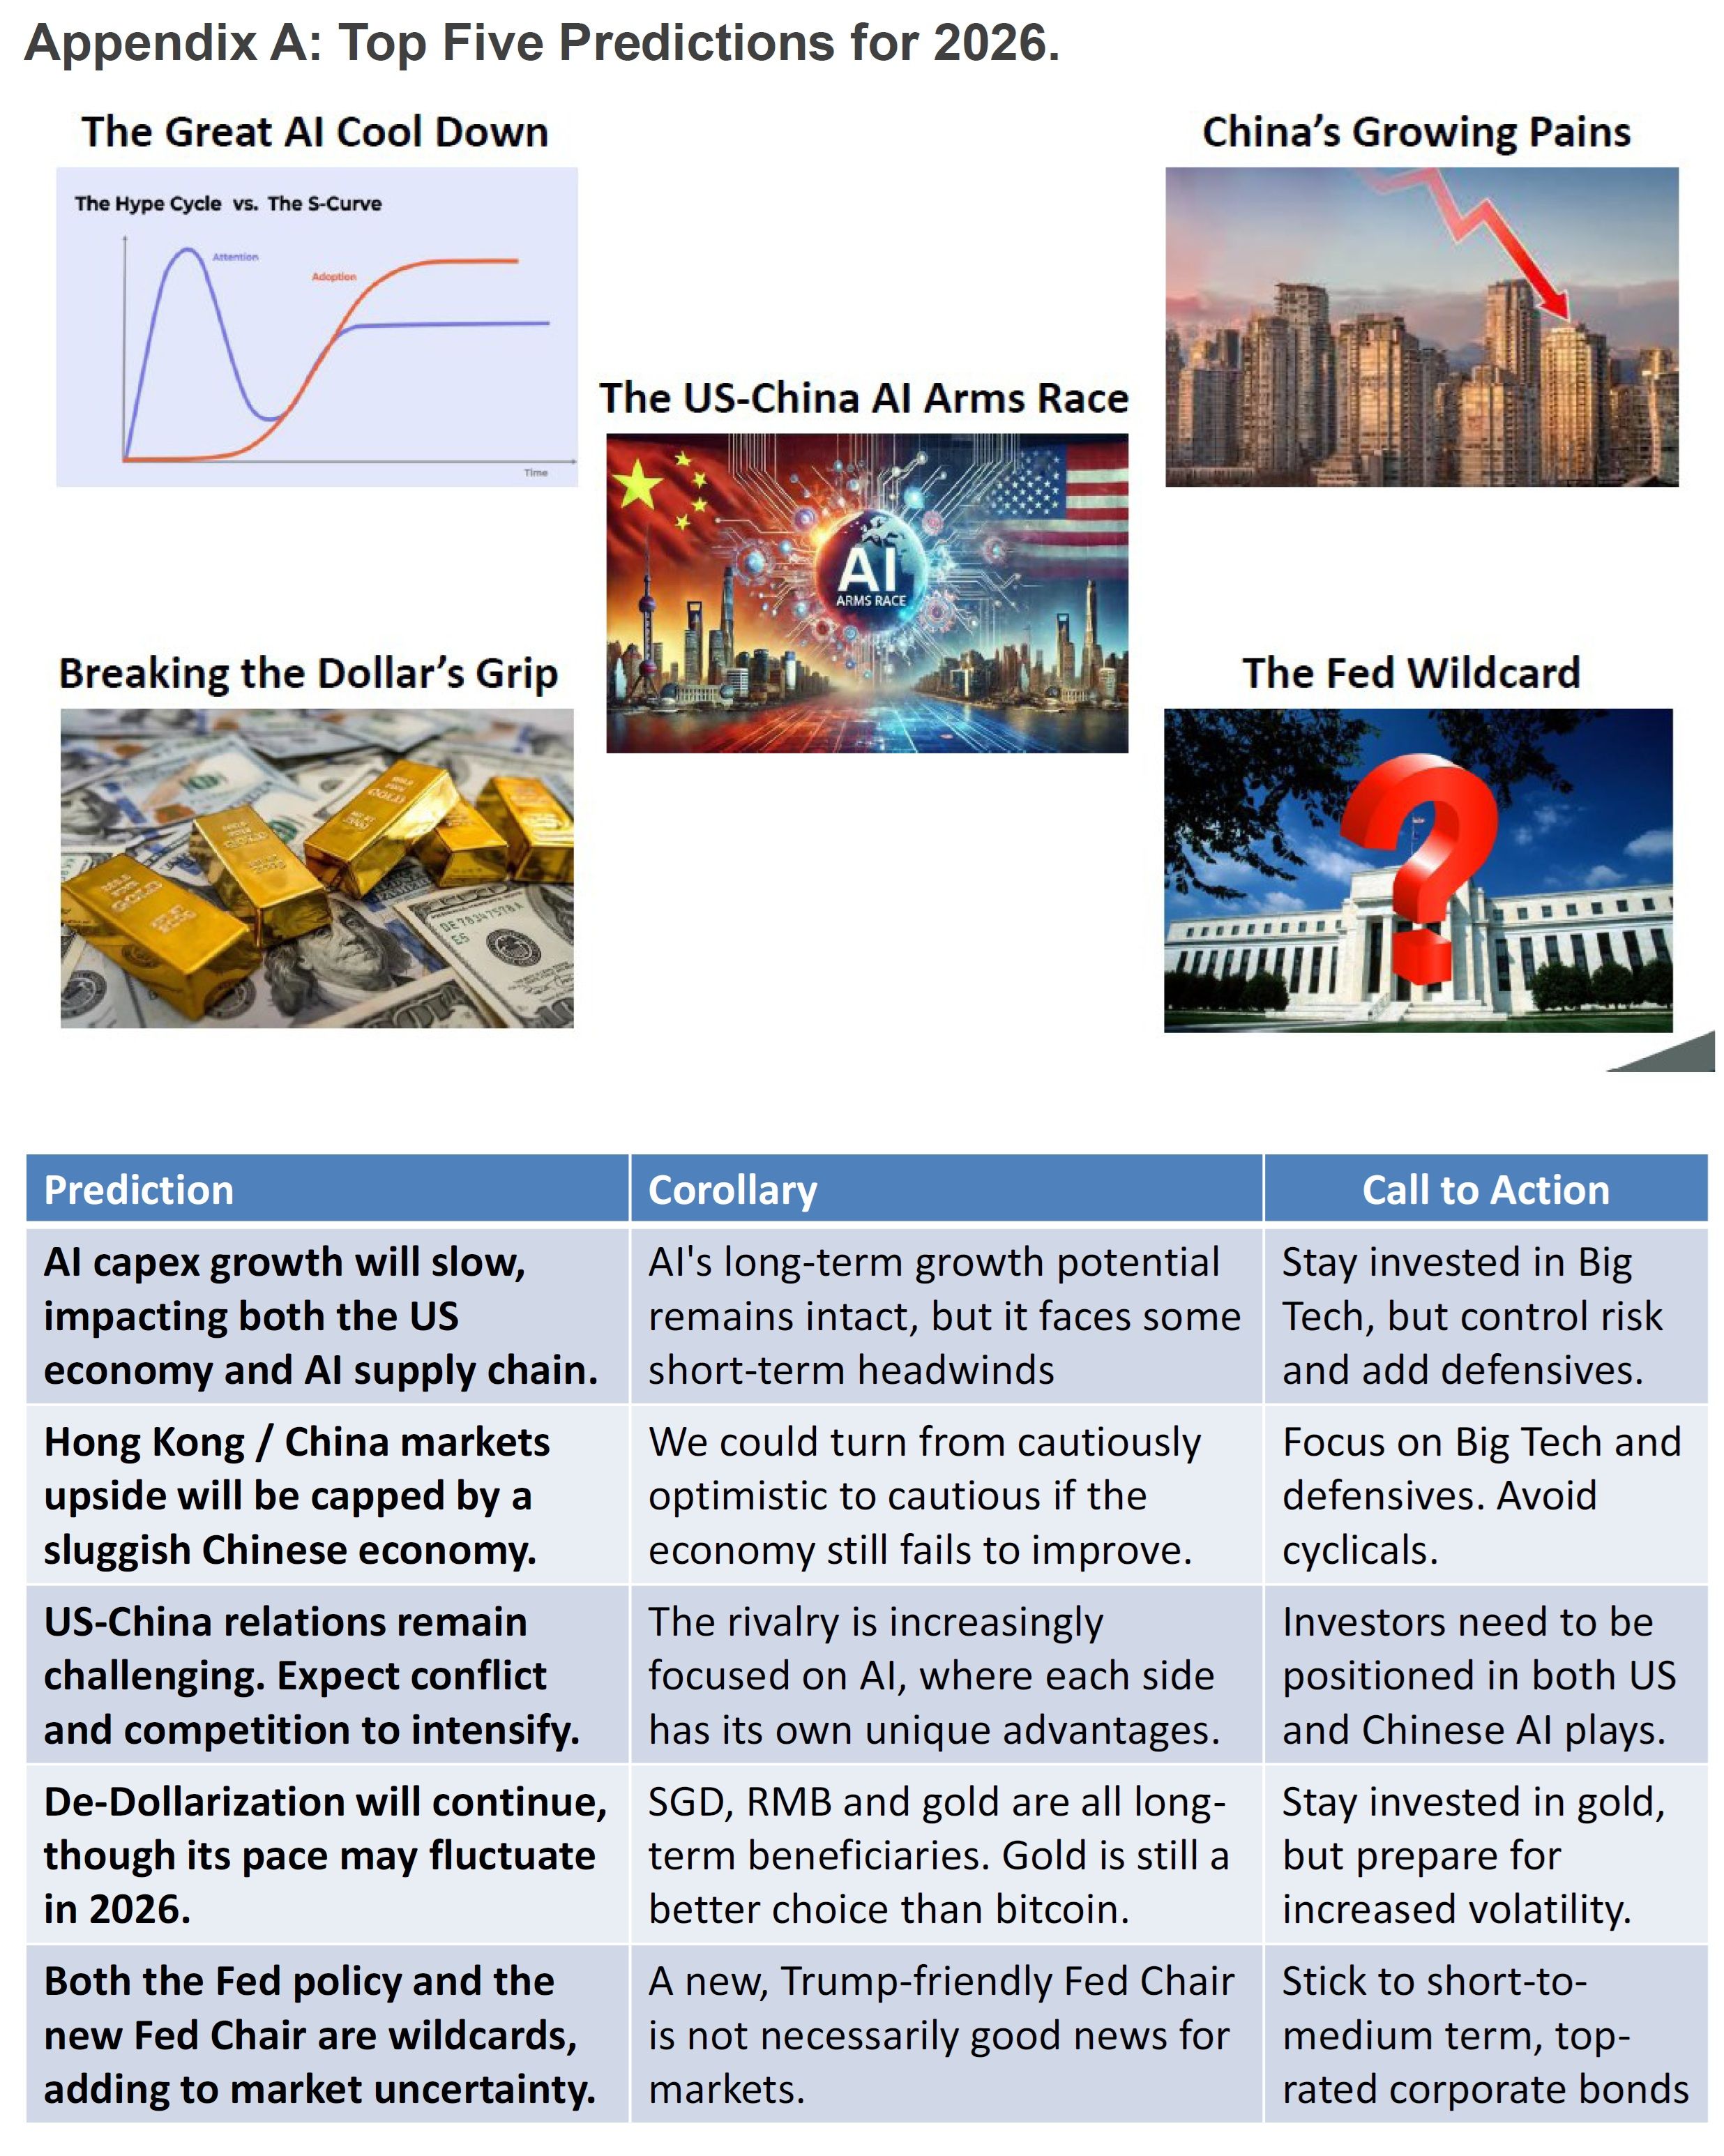
Appendix A: Top Five Predictions for 2026.
Appendix B: Must Watch Events for June 2026
Date | Macro Data | Sector / Company Events |
Jun 1 | China May Rating Dog PMI-Mfg, US S&P May PMI-Mfg Final. | Jensen Huang Keynote @ Computex Taipei, Macau May Casino Revenue |
Jun 2 |
| Computex Taipei (till Jun 5), Microsoft Build 2026 San Francisco (till Jun 3) |
Jun 3 | China May Rating Dog PMI-Svcs. US S&P May PMI-Svcs Final, Weekly EIA report | Earnings: AVGO |
Jun 4 | Initial Jobless Claims | SpaceX Roadshow, US May Total Vehicle Sales |
Jun 5 | US May Labor data (NFP/ Unemployment Rate) | US May Used Car Prices |
Jun 7 | China May FX Reserves |
|
Jun 8 |
| Trump meet major AI company leaders (on the week June 8-12) |
Jun 9 | US Apr Exports & Imports, China May Exports | Taiwan May Exports, Mizuho Technology Conference 2026 (till Jun 10), Goldman Global Healthcare Conference Miami (till Jun 11) |
Jun 10 | China May CPI/PPI, US May CPI, ECB Rate Decision (till 11 Jun), Weekly EIA report | TSMC May Monthly Sales. |
Jun 11 | US May PPI, Initial Jobless Claims, FIFA World Cup (till Jul 19) | Musk speaks @ ASML Tech Conference |
Jun 12 |
| SpaceX IPO debut |
Jun 13 | China May M2 Money Supply, New Yuan Loans, Outstanding Loan Growth, Total Social Financing |
|
Jun 15 | G7 Leaders’ Summit France (till 17 Jun), BOJ Rate Decision (till 16 Jun) |
|
Jun 16 | Fed Rate Decision (till June 17), China May Retail Sales, Industrial Production, Fixed Asset Investment (YTD), Unemployment rate
|
|
Jun 17 | 对话 CIO 系列 #9 (8:00-9:00 PM HKT/SGT) | Earnings: Trip.com (TCOM/9961.HK) est |
Jun 18 | US Initial Jobless Claims, SNB Rate Decision |
|
Jun 22 | China Jun LRP Fixing | Macau May Visitor Arrivals. |
Jun 23 | Taiwan Jun Export Orders, US S&P Jun Global PMI-Mfg & Svcs Flash | Amazon Prime Day (till Jun 26) |
Jun 24 | Weekly EIA report | Nvidia AGM |
Jun 25 | US 1Q GDP, May PCE, US Initial Jobless Claims |
|
Jun 26 |
| Macau May Hotel Occupancy Rate |
Jun 27 | China May Industrial Profits (YTD) |
|
Jun 30 | China Jun NBS PMI | China's Top 100 Developer Real Estate Sales (CIRC/CIH) (est) |
Appendix C: Global ETF Toolkit Highlights
Appendix D: Roadmap to Private Wealth Management Research
Publications & Events | |||
Report | Description | Report Date | Length |
Wealth Daily | A must-read before the open for overnight news, data points and market movements. | Daily | 5 pages |
Wealth Monthly | Comprehensive research covering macro trends, asset allocation, equities, bonds, funds, etc. | 2nd week of each month | 15 pages |
Fixed Income Monthly | Monthly review of interest rates, corporate credits and bond funds | 1st week of each month | 15 pages |
CIO Quarterly Review | A review of our core views and recommendations, incorporating quantitative and qualitative analysis | Quarterly | 5 pages |
Wealth Flash | Thought-provoking piece for knowledge sharing, thematic investing and actionable ideas | Depends | 5 pages |
US Bi-Weekly Outlook | Curated insights on the US, Hong Kong and China markets, including sector trends, potential stock movers and previews of upcoming events | Rotating every Monday | 5-10 pages |
China Bi-Weekly Outlook | |||
CIO Series Webinar | A monthly webcast to share market outlook and investment insights, with occasional guest speakers | Monthly | 1 hour |
Calls to Action | ||
Type of Calls | Description | Markets |
Core Recommendation | High conviction stock picks with a minimum one-year horizon | US, China |
Trading Buy | Medium conviction, short-term trading ideas | US, China |
All ETF Model Portfolio | ETF-only model portfolio for global asset allocation | Global |
US Stock Model Portfolio | Actively managed portfolio of stocks based on our US Core Recommendations and Trading Buys | US |
China Stock Model Portfolio | Actively managed portfolio of stocks based on our Chinese Core Recommendations and Trading Buys | China |
Note: Report lengths are approximate and may vary. Please contact research@uobkh.com if you’d like to subscribe to any research above.
Be sure to subscribe to our Wealth Vision YouTube channel, including replays of our CIO Series and much more.
https://www.youtube.com/@uobkh_wealthvision
Appendix E: UOB FX, Interest Rates & Commodities Forecasts
CIO Summary
Fed Wildcard unfolds as the war on inflation begins. The global fight against oil-driven inflation has begun, as the ECB is widely expected to raise rates this week with macro data pushing the Fed toward a more hawkish stance. The probability of a Fed rate hike by year-end has surged to 72% from 45% a week ago (CME FedWatch).
Multiple contractions already underway. History shows that the most direct impact of higher inflation and rates on equities is valuation compression: a sharp sell-off without immediate deterioration in underlying fundamentals. The recent corrections in AI stocks under macro pressures suggest this contraction is already happening, though it has so far been transitory.
Flash crashes to resurface; September a key turning point. We expect volatility spikes to continue, as the market oscillates between rate‑driven pullbacks and AI‑driven rebounds. Sustained macro repricing risk will likely kick in around September before the expected Fed rate hike in December.
Our All ETF Model Portfolio gained 1.6% in May and returned 5.7% YTD. This was mainly driven by Nasdaq 100 (QQQ) +10.6% and EM ex-China (EMXC) +12.0% and. We continue to underweight equities, equal-weight bonds and overweight gold.
Our US Stock Model Portfolio advanced 4.0% in May and 10.8% YTD. Top 3 performers: Micron (MU) +87.8%, Snowflake (SNOW) +87.3%, AppLovin (APP) +37.4%.
Our China Stock Model Portfolio fell 2.5% in May and dropped 2.5% YTD. Top 3 performers: Montage Technology (688008.SH) +47.4%, Weichai Power (000338.SZ) +14.4% and TSMC (TSM) +5.7%.
Our next CIO Series webinar is scheduled for 7:00 PM on June 23, with Yanni Angelakos, Head of Investment Insights at Nasdaq. Title: Macro Shocks vs. AI Tailwinds – a Delicate Balancing Act for US Markets. Registration link below:
Core Views and Recommendations
Asset Class | Core Views | Core Recommendations |
Equities | We remain cautious on global equities given a combination of tariffs, geopolitical risk and extreme market concentration (related to AI). In particular, the Iran oil shock adds another layer of macro uncertainty by pushing inflation higher, dampening growth and raising policy challenges. | Underweight equities in global asset allocation See our All ETF Model Portfolio below. |
US Equities | We are cautious on US equities for the same reasons above (including the “Fed Wildcard”), compounded by valuation concerns. Within US equities, we maintain high conviction in the AI’s long-term, structural growth trajectory, despite concerns about macro uncertainty and concentration risk. We also favour well-managed, “true defensive” companies, which continue to demonstrate stability and resilience in an uncertain macro environment. We continue to like energy – both as a hedge against geopolitical risks and a key beneficiary of surging AI electricity demand. | Underweight US equities in global asset allocation (All ETF Model Portfolio) AI: AMZN, AVGO, META, MSFT, NVDA Defensives: BRK/B, JNJ, PG, WMT, XLP Energy: OXY, XLE See our US Stock Model Portfolio below. |
China Equities | We are also cautious on China due to continuing macro weakness (“China’s Growing Pains”), i.e, a subdued real estate market and sluggish domestic demand, coupled with external shocks and a lack of stimulus. Having said that, the Iran oil crisis may be a blessing in disguise for China, as it could amplify Beijing’s manufacturing edge and supply chain dominance, thus benefiting industrial production and exports. Within China equities, we also favour AI, defensives and energy. | Overweight China equities in global asset allocation (All ETF Model Portfolio) AI: 0700.HK, 9988.HK, TSM Defensives: 0941.HK, 0005.HK Energy: 0857.HK, 300750.SZ / 3750.HK Others: 0027.HK, 0175.HK, 6690.HK, 9961.HK See our China Stock Model Portfolio below. |
Fixed Income | Bonds remain an essential asset class in a multi-asset portfolio, offering stable income, capital preservation, and diversification. Current bond yields also remain attractive relative to long-term inflation expectations. However, the US fiscal imbalance and the related de-dollarisation trend could be potential game changers for fixed income investing. In addition, both the Fed policy and the new Fed chair are wildcards, adding to market uncertainty in 2026. | Overweight bonds in global asset allocation (All ETF Model Portfolio). We have changed our Core Recommendation from intermediate-term (5-7 years) IG bonds to short-duration (<3 years) bonds. Build a currency-diversified fixed income portfolio, incorporating local currency and FX hedged bonds or bond funds. See Appendix E for UOB’s currency views. |
Commodities | We expect de-dollarisation to continue in 2026 and beyond and view gold as a top beneficiary of this long-term trend. | Overweight gold in global asset allocation (All ETF Model Portfolio). |
CIO Commentary
The Iran war is yet to end; the fight against inflation has already begun. Australia has been the most aggressive in raising interest rates so far, by three times YTD and twice since the war outbreak, for a total of 75 bps. Meanwhile, the European Central Bank (ECB) is widely expected to raise rates for the first time in three years in response to the Iran oil shock. The US is falling behind, with the first Fed rate hike expected only in December 2026.
Rate hikes are not universally negative for equities. However, caution is still warranted for the following reasons:
The largest oil shock in history. With the Strait of Hormuz still closed and a major share of global oil supply offline, the International Energy Agency (IEA) estimates an accumulative supply loss of 12 million barrels per day (mb/d) from the Middle East – making this the largest oil disruption in history. Worst yet, a significant drawdown in oil inventories continues, with the US commercial crude stocks now 3% below the five-year seasonal average (a big deal) and Strategic Petroleum Reserves (SPR) dwindling to 357 million barrels (lowest in over four decades). All such data points suggest further upside to oil prices and higher inflation pressures if the crisis continues.
Inflation entering the second wave. Around the world, oil-driven inflation is not only confirmed but also broadening across nearly all sectors. This is evident in the latest US CPI data (see US Equities section below), where fuel inflation is now spilling over to food, shelter and travel. The contagion makes inflation even stickier, pushing the Fed toward a more hawkish stance. The probability of a Fed rate hike by year-end has surged to 72% from 45% a week ago, according to the CME FedWatch.
Unprecedented market complacence. Despite recent volatility, stock markets continue to downplay inflation and policy risks. As a matter of fact, all major markets are trading above their Feb 28 levels – when the Iran war first began – without properly accounting for the macro headwinds. Some markets, including Korea and Japan, even seem bubble-like, propelled by strong AI momentum. Granted, inflation may not have any direct impact on AI industry fundamentals. However, history shows that a valuation multiple contraction becomes inevitable in a rising rate environment, especially for high-growth, high PE stocks.
Such multiple contractions are already happening in the form of “flash crashes” recently. On May 12, the S&P 500 collapsed on a hotter-than-expected CPI print, only to recover within hours as dip-buyers stepped in. Last Friday (June 5), the market tumbled again on strong jobs data, with several AI-related stocks down double-digits in a single day.
We expect these volatility spikes to continue, as the market oscillates between rate‑driven pullbacks (top-down) and AI‑driven rebounds (bottom-up). Sustained macro repricing risk will likely kick in around September – a few months before the expected Fed rate hike in December. This is precisely why we remain cautious in the medium term.
Asset Allocation (All ETF Model Portfolio)
Our All ETF Portfolio for global asset allocation gained 1.6% in May, bringing the YTD return to 5.7%. Performance was mainly driven by strong gains in Nasdaq 100 (QQQ) +10.6%, EM ex-China (EMXC) +11.0% and S&P 500 (SPY) +5.3%, as geopolitical pressures appeared to ease.
Equities remain underweight (44.3% vs. 62.5%). We took profits in equities amid the market rebound in May, thus reducing our equity exposure from 48.5% to 44.3%.
US equity underweight (22.7% vs. 37.9%). We trimmed exposures to the S&P 500 (SPY) and Nasdaq 100 (QQQ), which gained 5.3% and 10.6% respectively in May, while adding to US Energy (XLE) following the May correction. XLE has been a short-term detractor, down 5.6% last month and off 8.1% QTD, but still up an impressive 26.7% YTD.
Developed Markets ex-US underweight (9.1% vs. 17.0%). DM ex-US (IDEV) contributed positively with a 2.3% return in May and a 9.6% return YTD. We cut exposure here due to the region’s greater vulnerability to the oil shock, including countries like Japan, Germany and Italy.
Emerging Markets ex-China equal weight (4.5% vs. 5.9%). EM ex-China (EMXC) was one of the strongest contributors, rising 11.0% in May and 39.0% YTD. We trimmed exposure to lock in gains after the strong run-up.
Fixed income slightly overweight (40.1% vs. 36.9%). Fixed income is also subject to macro and policy risks. Yet, it continues to provide relatively stable returns, up 0.3% in May and 0.8% YTD.
Gold remains overweight (5.9% vs. 0.0%). Gold (2840 HK) was down 1.9% in May but remained positive YTD at +3.6%. We continue to view gold as a portfolio diversifier and hedge against geopolitical risk, currency volatility and the longer-term de-dollarisation trend.
Cash stands at 9.7%. The cash buffer provides flexibility to buy on dips should market volatility create attractive entry points. As noted earlier, we expect macro-driven flash crashes to continue.
Equities
US Equities
Evidence of second-wave inflation continues to build: April CPI rose 3.8% yoy, beating expectations and showing signs of higher prices spreading beyond energy. May non-farm payrolls came in stronger-than-expected at 172K, more than double the consensus estimates. On both occasions (May 12 and June 5), US stocks tumbled with no major fundamental changes but on renewed rate hike fears. The CME FedWatch Tool now shows a 72% probability of a rate hike by year-end, up from 45% a week ago. We have been warning about a macro-driven multiple contraction for some time. It is finally happening.
Despite top-down concerns, we expect the S&P 500 to consolidate and drift higher from now till September with support from strong AI momentum (AI capex +83% in 2026) and robust earnings growth (+23% in FY2026). Beyond September, however, we think risks will tilt to the downside as markets begin to price in rate hikes (if any), the new Fed chair's six-month mark, the midterm election, and 2027 earnings projections from a high base. We remain cautious.
Our US Stock Model Portfolio advanced 4.0% in May and 10.8% YTD, slightly underperforming S&P 500 (SPY +5.3% MTD; 11.2% YTD). Gains were led by tech names like Micron (+87.8%), Snowflake (+87.3%) and Applovin (+37.4%), which more than offset the weakness in our Consumer Staples and Energy holdings.
Cash dropped from a peak of 30% to 19.2% as tech stocks grew within the portfolio, raising the total equity exposure. We entered new positions in Lumentum (LITE) and Qualcomm (QCOM) and added to existing positions in Berkshire (BRK/B) and Industrials (XLI). Meanwhile, we trimmed Consumer Staples (XLP), Nvidia (NVDA), Applovin (APP) and Broadcom (AVGO).
Top 3 performers: MU +87.8%, SNOW +87.3%, APP 37.4%,
Bottom 3 performers: WMT -12.1%, OXY -6.5%, XLE -5.6%.
Nvidia (NVDA) reported another strong set of results, with both revenue and guidance exceeding elevated buyside expectations. 1Q revenue grew 85% yoy to USD 81.6 bn, exceeding buy-side estimates of USD 81 bn. 2Q guidance also came in ahead of expectations. NVDA’s strong results have again validated its dominance in AI data centres.
Broadcom (AVGO) reported mixed results, with revenue beating consensus estimates but missing elevated buy-side expectations. Its AI semi segment grew +143% yoy to USD 10.8 bn, driven by robust demand for AI ASICs and networking solutions. The software business is also a bright spot, with growth accelerating to 8% yoy and guidance pointing to a 31% jump next quarter, as more CPU-intensive inference workloads support VMware pricing. Despite a 13% share price pullback post-earnings, our long-term thesis on AVGO remains intact, with its ASIC and networking businesses well positioned to deliver multi-year growth.
Walmart (WMT)’s FY1Q2027 results came largely in-line with expectations, with adjusted EPS rising 8.2% yoy. However, shares declined post results due to:
higher-than-expected fuel costs in delivery and fulfilment amid the Iran oil shock;
no increase to full-year guidance despite strong 1Q results
cautious management commentary on consumer spending, noting that lower-income shoppers are facing "financial distress."
We still view the reiterated full-year guidance as a positive signal, demonstrating WMT's ability to absorb higher fuel costs through its smart management, diversified revenue stream and scale advantage. Walmart remains a Core Recommendation and one of our "true defensive" holdings. The stock currently trades at 38x forward P/E with earnings expected to grow 11% in FY2027 and 13% in FY2028.
Must watch events in June: Microsoft Build 2026 San Francisco (Jun 2-3), US May Labor data (Jun 5), US May CPI (Jun 10), ECB Rate Decision (Jun 10-11), US May PPI (Jun 11), SpaceX IPO Debut (Jun 12), G7 Leaders’ Summit France (Jun 15-17), BOJ Rate Decision (Jun 15-16), Fed Rate Decision (June 16-17), Amazon Prime Day (Jun 23-26), Nvidia AGM (Jun 24). Earnings: AVGO (Jun 3), ORCL (Jun 10), MU (Jun 24), NKE (Jun 30). For more information, please see Appendix B.
China Equities
Our China Stock Model Portfolio fell 2.5% in May but still outperformed MSCI China (MCHI), which declined 4.3%. We also continue to beat the benchmark YTD (-2.5% vs MCHI -7.6%).
Cash increased marginally to around 18.4% as we net-sold stocks in May. We trimmed some TSMC (TSM) and CATL (300750.SZ) and bought Gigadevice (3986.HK) as a new position and added to China Mobile (0941.HK).
Top 3 performers: 688008.SZ +47.4%, 000338.SZ +14.4% and TSM +5.7%.
Bottom 3 performers: 0175.HK -17.8%, 3690.HK -11.8%, 9961.HK -11.7%.
Tencent (700.HK) missed earnings, with 1Q2026 revenue growth of +9%, slightly below expectations. A key debate is whether Tencent’s late entry into AI still allows it to catch up with its peers. If successful, it could drive a re-rating from ~13x to 20x PE. Recent developments are encouraging, as Tencent is reportedly preparing an AI agent launch in WeChat. Though the timing is still uncertain, Tencent is indeed making progress in its AI capabilities. Its Hunyuan (hy3) model has ranked among the top two on OpenRouter recently, despite being the first model by its new AI team.
Alibaba (9988.HK) also reported lower than expectedearnings, with 4QFY2026 revenue +3% yoy slightly missing consensus. Its Hong Kong shares showed resilience post-earnings on renewed AI optimism, with Alicloud revenue further accelerating to +38% yoy in the March quarter. Regarding the intense competitions in AI cloud and food delivery, Baba mentioned that:
Alicloud margin has actually expanded, supported by price hikes and a mix shift to higher-margin MaaS;
Quick commerce unit economy (UE) is on track for a turnaround in FY2027.
A key debate for Alibaba is whether its full-stack AI leadership – from T-head chips to Tongyi Qianwen models – can sustain cloud re-acceleration and drive a multiple re-rating. Though we remain mindful of core commerce headwinds from weak domestic consumption, we are impressed by Alibaba’s AI pricing power and inference efficiency gains. This remains the best full-stack AI player in China and our Core Recommendation,
Trip.com (9961.HK) remains our high conviction pick in Chinese Internet as the undisputed online travel platform (OTA) leader with about 55% market share in China and a dominant player in the high-end and business travel segments. Due to the regulatory overhang from a Chinese antitrust investigation, Trip.com trading at an undemanding 11.6x FY2026 P/E. Ahead of its 1Q2026 earnings (June 17 est date), our institutional analyst expects 14-15% yoy revenue growth to RMB 15.9 bn, with 81% gross margin – unchanged and anchored by surging international tourism. The company announced a strategic partnership with Galaxy Macau (June 4), signalling a compelling pivot to high-margin live events.
Must watch events in June: Computex Taipei (till Jun 5), China May Exports (Jun 9), China May CPI/PPI & TSMC May Monthly Sales (Jun 10), China May Vehicle Sales (Jun 11), Fed Rate Decision (June 16-17). Earnings: Meituan (June 1), Trip.com (Jun 17). For more information, please see Appendix B.
Fixed Income
Below is the CIO Summary from our latest Fixed Income Monthly (June 4, 2026), for Professional / Accredited Investors only. Ping benjamintan@uobkh.com if you’d like to receive the full report.
Competing macro forces put Warsh in a bind, reinforcing our call on the Fed Wildcard. Oil-driven inflation enters the second wave, while US consumption and corporate America remain resilient. Mixed macro data, coupled with a deeply divided Fed, presents unprecedented challenges for new Fed Chair Kevin Warsh.
Three longer-term forces keep yields high. The Fed Wildcard, fiscal expansions, and surging financing demand for AI capex all put upward pressure on Treasury yields. As a result, 4.5% may not be a reliable upper bound for 10-year Treasury yields.
Maintain our Core Recommendation on high-quality, investment-grade bonds with short durations (< 3 years). Tactical trading of intermediate durations around the 4.5% level should be approached with care.
This month’s bond highlight: taking profit in MEITUA 4.625% 2 Oct 2029.
Currencies
We rely on our associate UOB for currency views. Below are the latest insights from its Quarterly Global Outlook 3Q2026 (June 5, 2026). Please refer to Appendix E for UOB’s official forecasts on FX, interest rates and commodities. You can also access the full selection of UOB research on its research portal.
Major FX Strategy: Monetary policy to take over in 2H2026 as key driver
Looking ahead to 2H2026, our base case remains that diminishing geopolitical risk premia will erode a key pillar of USD support. In turn, market focus is likely to shift back toward monetary policy differentials. Our Fed view has notably pivoted less dovish relative to the pre-war baseline. Concurrently, select G10 central banks have already initiated tightening cycles. As such, we retain a medium-term bearish bias on the USD. The continued narrowing in US rate differentials versus G10 peers should act as a structural headwind for the USD. Consistent with this view, our updated DXY forecasts are still biased lower, at 97.9 in 3Q2026, 97.0 in 4Q2026, 95.7 in 1Q2027, and 94.9 in 2Q2027.
Risks to our USD outlook remain skewed to the upside should the closure of the Strait of Hormuz persist deeper into 2H2026. Under such a scenario, sustained high oil prices—potentially at or above USD120/bbl—would likely amplify second-round inflation effects, particularly through wages, services, and core components. This would present a material challenge for the Fed, limiting its ability to look through supply-driven price pressures. In turn, the policy narrative could shift more decisively towards the prospect of renewed tightening into year-end. Such a development (while not yet our base case) would represent a clear upside risk to the USD and necessitate a reassessment of our baseline expectation for a weaker dollar trajectory.
Asian FX Strategy: Recovery deferred as Hormuz risks linger on
We have consistently highlighted in prior publications that Asia FX remains disproportionately exposed to prolonged Middle East tensions. Since the onset of the Iran conflict, most regional currencies have weakened against the USD, with net energy importers—such as PHP, THB, INR and IDR—underperforming. The ongoing closure of the Strait of Hormuz, now into its fourth month, has intensified fiscal strains associated with securing energy supplies, particularly in economies with administered fuel pricing frameworks. Each additional day of disruption heightens inflation risks across the region, while macro buffers—including current account positions and FX reserve adequacy—have eroded in several cases.
On balance, we judge that a cautious stance remains warranted until there are clearer signs of normalisation in the Strait of Hormuz and a meaningful easing in regional inflationary pressures. Accordingly, we maintain a defensive bias on Asia FX into 3Q26 and push back the expected timing of a more sustained recovery to 4Q26. We expect CNY, MYR and SGD to stay resilient as they have thus far during the Middle East conflict, while TWD and KRW are expected to post a stronger recovery due to sustained AI tailwinds. On the other hand, PHP, IDR and INR are expected to underperform and stay near record lows against the USD.
Appendix A: Top Five Predictions for 2026.
Appendix B: Must Watch Events for June 2026
Date | Macro Data | Sector / Company Events |
Jun 1 | China May Rating Dog PMI-Mfg, US S&P May PMI-Mfg Final. | Jensen Huang Keynote @ Computex Taipei, Macau May Casino Revenue |
Jun 2 |
| Computex Taipei (till Jun 5), Microsoft Build 2026 San Francisco (till Jun 3) |
Jun 3 | China May Rating Dog PMI-Svcs. US S&P May PMI-Svcs Final, Weekly EIA report | Earnings: AVGO |
Jun 4 | Initial Jobless Claims | SpaceX Roadshow, US May Total Vehicle Sales |
Jun 5 | US May Labor data (NFP/ Unemployment Rate) | US May Used Car Prices |
Jun 7 | China May FX Reserves |
|
Jun 8 |
| Trump meet major AI company leaders (on the week June 8-12) |
Jun 9 | US Apr Exports & Imports, China May Exports | Taiwan May Exports, Mizuho Technology Conference 2026 (till Jun 10), Goldman Global Healthcare Conference Miami (till Jun 11) |
Jun 10 | China May CPI/PPI, US May CPI, ECB Rate Decision (till 11 Jun), Weekly EIA report | TSMC May Monthly Sales. |
Jun 11 | US May PPI, Initial Jobless Claims, FIFA World Cup (till Jul 19) | Musk speaks @ ASML Tech Conference |
Jun 12 |
| SpaceX IPO debut |
Jun 13 | China May M2 Money Supply, New Yuan Loans, Outstanding Loan Growth, Total Social Financing |
|
Jun 15 | G7 Leaders’ Summit France (till 17 Jun), BOJ Rate Decision (till 16 Jun) |
|
Jun 16 | Fed Rate Decision (till June 17), China May Retail Sales, Industrial Production, Fixed Asset Investment (YTD), Unemployment rate
|
|
Jun 17 | 对话 CIO 系列 #9 (8:00-9:00 PM HKT/SGT) | Earnings: Trip.com (TCOM/9961.HK) est |
Jun 18 | US Initial Jobless Claims, SNB Rate Decision |
|
Jun 22 | China Jun LRP Fixing | Macau May Visitor Arrivals. |
Jun 23 | Taiwan Jun Export Orders, US S&P Jun Global PMI-Mfg & Svcs Flash | Amazon Prime Day (till Jun 26) |
Jun 24 | Weekly EIA report | Nvidia AGM |
Jun 25 | US 1Q GDP, May PCE, US Initial Jobless Claims |
|
Jun 26 |
| Macau May Hotel Occupancy Rate |
Jun 27 | China May Industrial Profits (YTD) |
|
Jun 30 | China Jun NBS PMI | China's Top 100 Developer Real Estate Sales (CIRC/CIH) (est) |
Appendix C: Global ETF Toolkit Highlights
Appendix D: Roadmap to Private Wealth Management Research
Publications & Events | |||
Report | Description | Report Date | Length |
Wealth Daily | A must-read before the open for overnight news, data points and market movements. | Daily | 5 pages |
Wealth Monthly | Comprehensive research covering macro trends, asset allocation, equities, bonds, funds, etc. | 2nd week of each month | 15 pages |
Fixed Income Monthly | Monthly review of interest rates, corporate credits and bond funds | 1st week of each month | 15 pages |
CIO Quarterly Review | A review of our core views and recommendations, incorporating quantitative and qualitative analysis | Quarterly | 5 pages |
Wealth Flash | Thought-provoking piece for knowledge sharing, thematic investing and actionable ideas | Depends | 5 pages |
US Bi-Weekly Outlook | Curated insights on the US, Hong Kong and China markets, including sector trends, potential stock movers and previews of upcoming events | Rotating every Monday | 5-10 pages |
China Bi-Weekly Outlook | |||
CIO Series Webinar | A monthly webcast to share market outlook and investment insights, with occasional guest speakers | Monthly | 1 hour |
Calls to Action | ||
Type of Calls | Description | Markets |
Core Recommendation | High conviction stock picks with a minimum one-year horizon | US, China |
Trading Buy | Medium conviction, short-term trading ideas | US, China |
All ETF Model Portfolio | ETF-only model portfolio for global asset allocation | Global |
US Stock Model Portfolio | Actively managed portfolio of stocks based on our US Core Recommendations and Trading Buys | US |
China Stock Model Portfolio | Actively managed portfolio of stocks based on our Chinese Core Recommendations and Trading Buys | China |
Note: Report lengths are approximate and may vary. Please contact research@uobkh.com if you’d like to subscribe to any research above.
Be sure to subscribe to our Wealth Vision YouTube channel, including replays of our CIO Series and much more.
https://www.youtube.com/@uobkh_wealthvision
Appendix E: UOB FX, Interest Rates & Commodities Forecasts
Disclosures and disclaimers
This report is provided subject to, and must be read together with, the full Disclosures / Disclaimers available at the following link: https://research-api.uobkayhian.com/assets/disclaimer/b2112181-0bf2-4c07-af37-3d7129735e61, which are incorporated by reference into this report. In particular, this report is intended for general circulation and informational purposes only and does not constitute personal investment advice or a recommendation to buy or sell any investment product or security. You should independently evaluate the information and, where necessary, seek advice from a qualified financial adviser regarding the suitability of any investment. Analyst certifications required under applicable regulations, including SEC Regulation AC (where relevant), are included in this report. By accessing, receiving or using this report, you acknowledge that you have read, understood and agreed to be bound by the Disclosures / Disclaimers, as may be amended, supplemented or updated from time to time.


